Market overview
1.1 Definition and scope of the study
Ice cream is a food made from from milk, sugar, fruit and a variety of flavours. A sorbet consists solely of sugar syrup and fruit pulp or flavorings.
There are different types of ice cream available in shops: cones and sticks (sometimes sold individually), ice cream specialities to share (logs and ice cream cakes) or even fruit tubs and jars of ice cream and sorbets sold in large food stores (e.g. supermarkets).
In terms of volume, the home consumption market is dominated by individual specialities (cones, sticks, etc.) and bulk sorbets and ice cream (particularly fruit tubs), with the remainder consisting of seasonal collective specialities (Christmas logs, etc.). It is the snack ice segment that plays the most important role in the sale of ice cream during the summer period and ice cream consumption varies considerably during the year and from one year to the next, depending on the weather conditions.
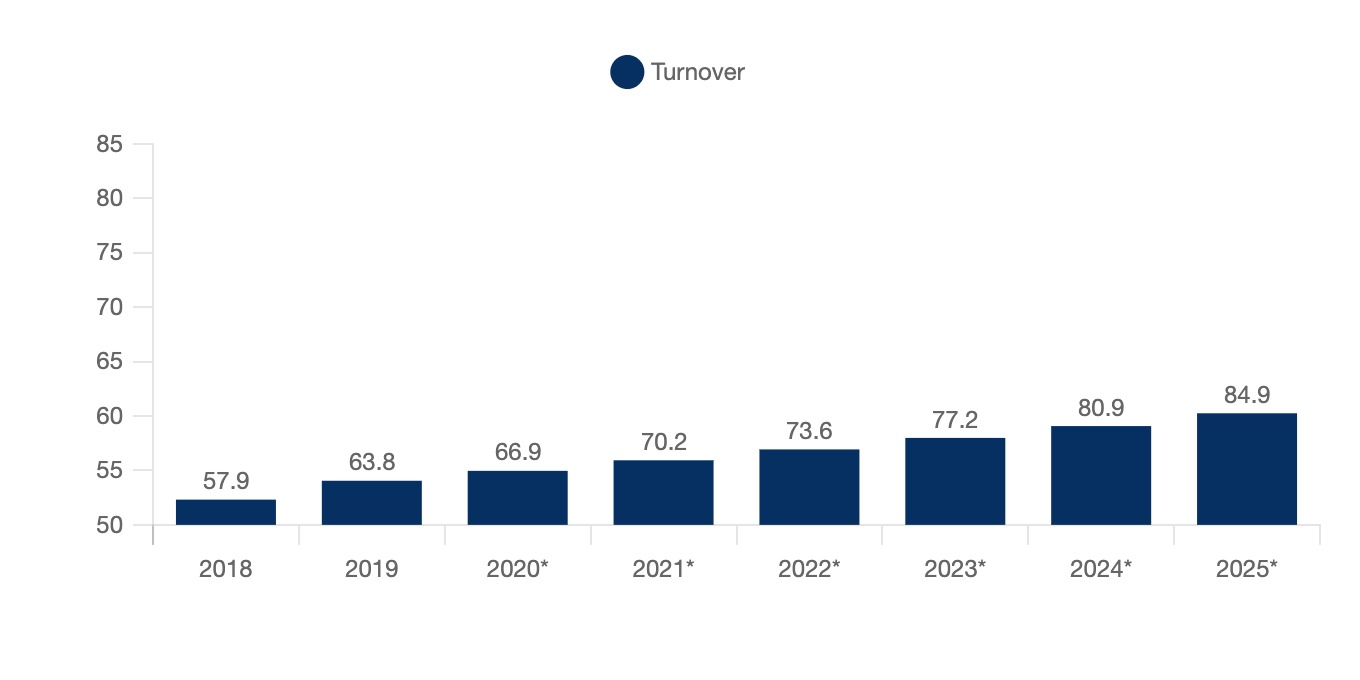
The world market for ice cream and sorbets was estimated at 57.9 billion in 2018. It is expected to grow at a CAGR (compound annual growth rate) of 4.9% between 2019 and 2025 to reach $84.9 billion by 2025. The global market is highly fragmented, but some of the main market players include Unilever, Mars, Nestlé, General Mills, Lotte and Dunkin’ Brands.
Ice creams can be categorised in different ways:
- Typology (cones, sticks, tubs etc)
- Flavours
- Segmentation (choc snacks, luxury ice cream, premium)
- Plant based or not
- Artisanal or industrial
In 2018, 385 million litres of ice cream were consumed by the British. The UK is a net importer of ice cream, regularly importing between three and four times the amount of ice cream it exports. Ice cream imports into the UK mostly come from France, Italy and Germany.
The overwhelming favourite ice cream in the UK is the classic Magnum, with almost 30% of Britons admitting preference for this type of ice cream. Vegan ice cream is a segment that is expected to grow rapidly over the next few years (CAGR of 7%) due to consumers' increasing health and ecological concerns. Vanilla is the favourite ice cream flavour for 84% of Britons.
The COVID-19 pandemic had a positive impact on the ice cream market in the UK. In fact, sales increased by 17%, compared to 2019, with companies like Mackie’s further consolidating a larger share of the national market. After the end of lockdown Britons wanted to be out, and the opening coincided with warmer summer months resulting in increased ice cream consumption.
1.2 The global ice cream market is growing
The global market for ice cream and sorbets was estimated at $63.8 billion in 2019. It is projected to grow at a CAGR (compound annual growth rate) of 4.9% between 2019 and 2025 to reach $84.9 billion in 2025.
World ice cream and sorbet market
World, 2018-2025*, in billions of dollars
This growth is explained by the development and rise in living standards in emerging countries, particularly in Asia. Indeed, the ice cream and sorbet market in Asia-Pacific is expected to grow at a CAGR of 5.6% between 2019 and 2025. Moreover, market growth is also driven by an increase in the range of products due to the growing health concerns of populations. China is the largest market globally, surpassing the United States. In South America, Brazil is understandably the largest market for ice creams. The trend regarding the African continent is consistent with other regions and is expected to grow at a CAGR of 4.2% between 2020-2023 [DPO].
Different types of ice cream are becoming more popular. Ice cream for immediate consumption is growing due to the increasing demand for snacks in small portions. Takeaway ice cream is also in high demand due to the increasing number of occasions and gatherings at home where ice cream is consumed as a snack or dessert. Finally, artisanal ice cream is popular with health-conscious consumers because of its healthy ingredients such as nuts and fruit, natural flavours and organic products.
Demand for high quality 'premium' ice cream is also increasing due to increasing health consciousness by a larger segment of the population who appreciate quality and origin of ingredients as well as exotic flavours. Greater degrees of urbanisation also seem to be playing a role in higher consumption of ice cream with an increase is retail sales being observed. Additionally, a boom is fast food chain restaurants is also resulting in increase consumption as these type of establishments are important end-users [DPO].
Higher living standards and disposable wages in countries of South and East Asia is increasing the purchase of ice cream products in these regions.
The global market is highly fragmented, but major players include Unilever, Mars, Nestlé, General Mills, Lotte and Dunkin' Brands. [ Mordor Intelligence ]
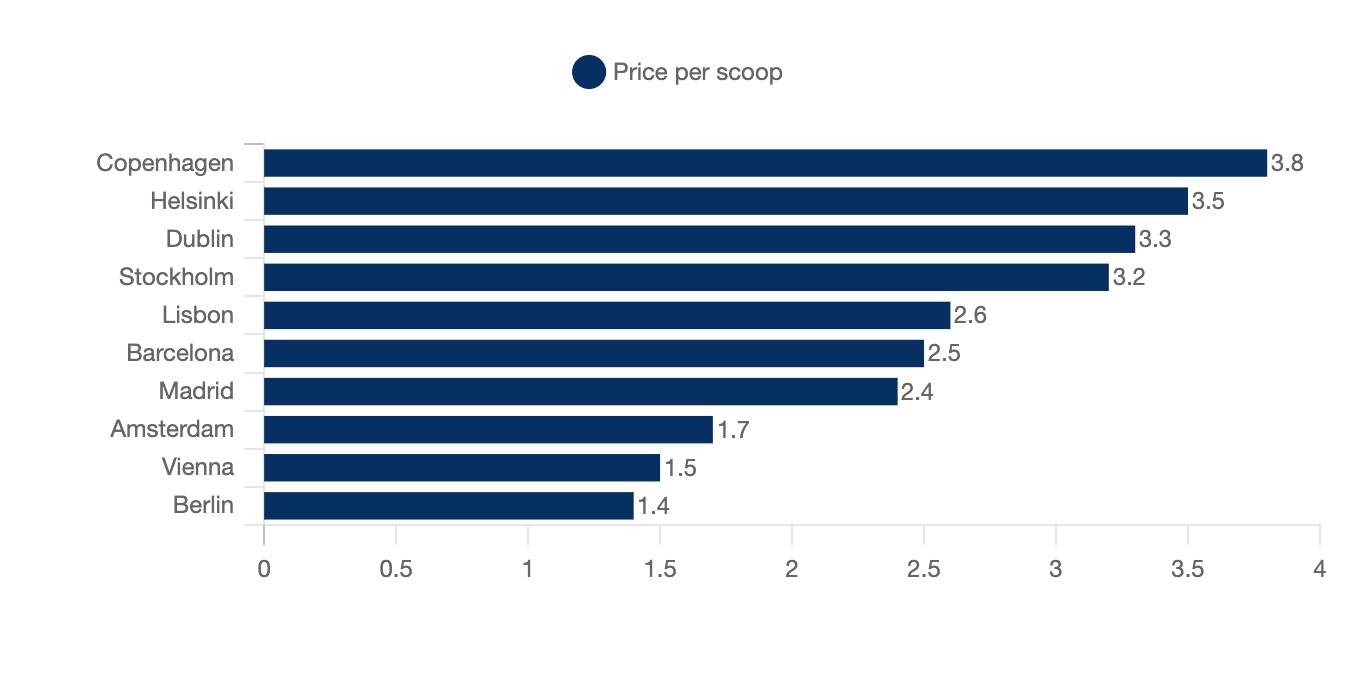
Ice cream prices also vary from country to country and city to city in Europe. A study conducted by Sonnenklar revealed that the cities with the highest average price for one ice cream scoop (also known as one 'ball' in other places) are Copenhagen, Helsinki, Dublin and Stockholm.
Average price of one ice cream scoop
European cities, 2018, in euros
From now on, for conciseness' sake and to prevent repetition, the ice cream and sorbet market will be referred to only as 'the ice cream market'. However, sorbets are also included in the analysis below
1.3 The growing UK market
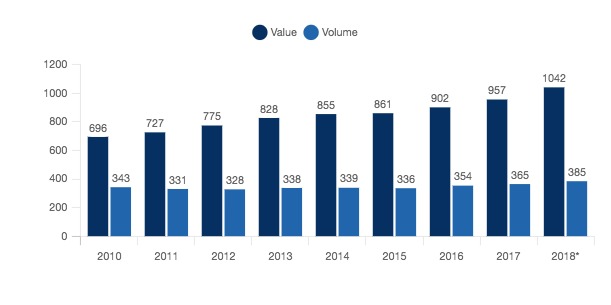
In the UK the retail value of ice cream has been increasing for over a decade. The same cannot be said for the retail volume of ice cream in the UK, which has fluctuated. In 2010 the retail value and volume of this market were estimated at 727 million GBP and 345 million litres, respectively. By 2018 these figures were projected to be 1.042 billion GBP and 385 million litres.
Evolution of retail value and volume of ice cream
UK 2010-2018, in millions of GBP and millions of litres
As we can see from this graph, the retail value of ice cream has been drastically increasing, with the retail volume staying around the same, some years increasing and some decreasing. There is a premuimisation of the market with market growth being driven by the price instead of the volume.
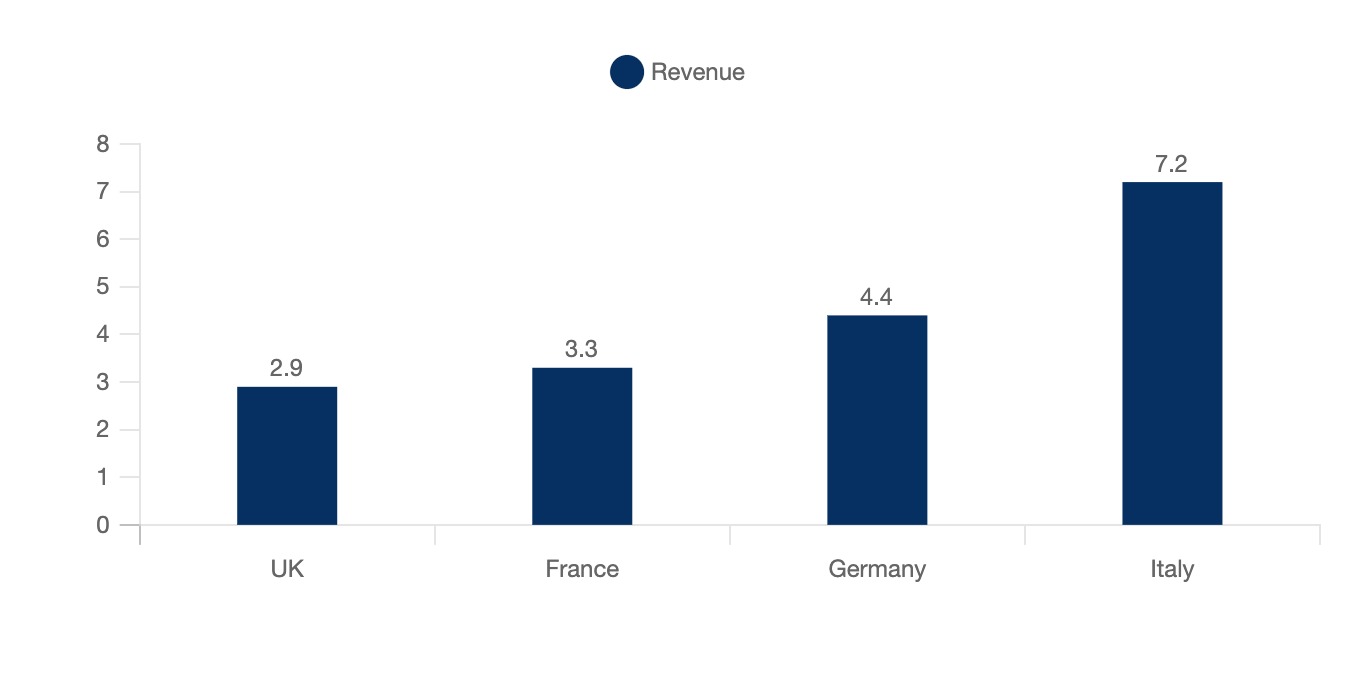
For ice cream manufacturers in the UK, the market is not exactly stable, both in terms of volume and in terms of value. After seeing a period of growth in the early 2010s, there was a massive drop off in 2014, followed by a very slow recovery leading up to 2019. However, in 2016, the ice cream market in the UK had generated total revenues of 2.9 billion GBP, growing by 4.4%. This is smaller than France (3.3 billion GBP), Germany (4.4 billion GBP) and Italy (7.2 billion GBP). However, the British market is indeed expected to keep growing and reach a value of 3.5 billion GBP by 2021 [Collective Equity]
Total revenues of the ice cream market
Europe, 2016, in billions of £
In 2016 a total of 454 million litres of ice cream were consumed in the UK, this is expected to rise to almost 533 million by 2021 which, apparently, is enough to completely fill up the Shard of London with ice cream [Collective Equity]
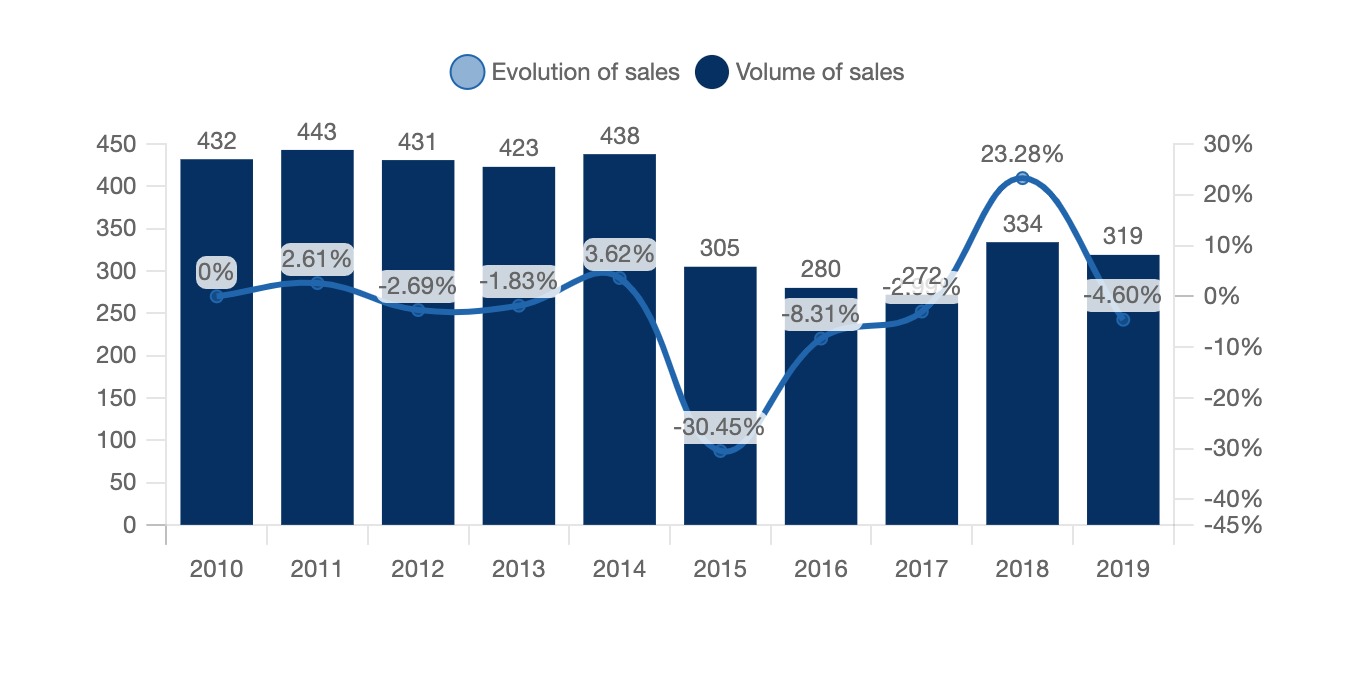
Regarding manufacturing, the picture is not so rosy. UK manufacturer's ice cream sales from 2009 to 2019 have not been constant. From 2009 to 2013 sales remained relatively the same, fluctuating between 420 million and 440 million litres sold. 2014, however, saw a staggering drop of almost 140 million litres sold, with sales dipping below 275 million litres in 2016. Sales seemed to recover in 2017 and 2018 after dipping again in 2019. Despite a relative recovery in 2018, ice cream sale levels comparable to the years of 2009-2013 have not yet been reached. What can partly explain this is a shift of consumers to healthier, lower calorie but more expensive product, a trend that was noticed also in Canada. The growth in sales in 2018, in relation to 2017, can be largely attributed to a record hot summer (Highs of 39 °C in parts of the UK) and lasting heat waves [Office for National Statistics - Prodcom]
Volume and evolution of ice cream sales
UK, 2009-2019, in litres and %
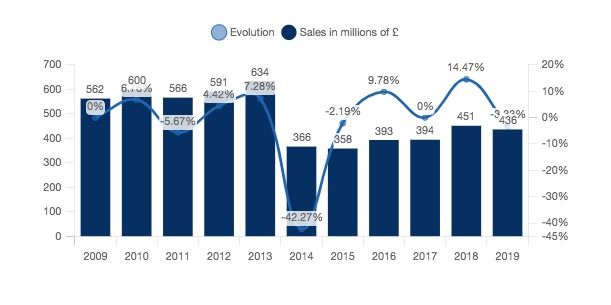
Regarding UK manufacturer's sales of ice cream in terms of value, the picture is quite similar (volume and value can often be correlated). The years 2009-2013 were relatively stable, with only slight fluctuations, with a massive drop-off in 2014 a slight recovery in 2018 but never reaching 2009-2013 levels. 2013 was the peak in terms of value with a total of 636 million GBP being achieved. Despite the drastic decrease, in the years 2021-2024 the ice cream market is expected to consistently and gradually grow reaching sales of up to 510 million GBP in 2024.
Sales and evolution of sales of ice cream
UK, 2009-2019, in millions of £ and %
2019 was a decidedly worse year than 2018 in the sale of ice cream, when consumers bought 7.9 million litres less, a decline of 2.1%. However, some of the biggest brands managed to mitigate these losses, with an average increase of price of 3.1% per litre, year-on-year growth was of 0.8% [Nielsen]
1.4 Import & Export: Britons prefer foreign ice cream
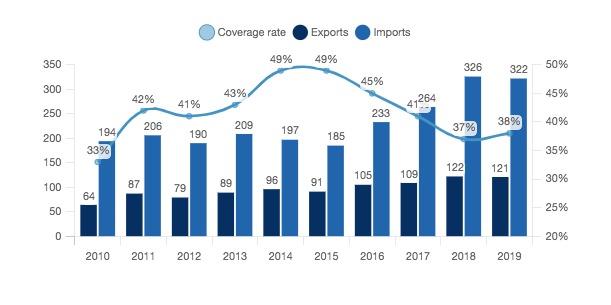
The stereotypes and anecdotes of the poor quality of British cuisine seem to extend within the reality of the ice cream market. The UK historically imports a lot of ice cream from abroad (particularly Germany, Italy and France). However, the UK also exports its own ice creams throughout the world.
Using the UN Comtrade database, and the specific code 2105 which corresponds to ice creams, which tracks imports and exports, we can observe the patterns of ice cream trade in the UK.
Imports and Exports of ice cream
UK, 2010-2019, in millions of £
As can be observed in the graph above it took 10 years for British ice cream exports to (almost) double. In these 10 years, exports grew by more than 65% from 194 million GBP in 2010 to 322 million GBP in 2019. The years of 2012 and 2015 saw noticeable dips in both imports and exports, the same was observed in 2019, but it was negligible. Both imports and exports of ice cream to and from the UK stayed almost the same between 2018 and 2019.
As mentioned above, the UK's main trade partners regarding ice cream are from the EU. In fact, 57% of EU ice cream exports (to non-EU countries) were destined to the UK. The flow of trade is in fact bi-lateral with 70% of non-EU ice cream imports coming from the UK [
Euro Stat]
1.5 The Impact of COVID-19
The COVID-19 pandemic and ensuing economic fallout had a significant impact on the ice cream market in the UK. However, unlike most other markets and economic segments ice cream sales actually increased, and the market as a whole grew. This can be attributed to different reasons:
- Families are the main consumers of ice creams: due to the extended periods of lockdown more families were more at home, this resulted in increased ice cream sales and therefore growth
- Lockdowns, extended isolation, periods of sadness/depression due to the losing of jobs, family members and social contact all led to a boost in the consumption of ice cream. Despite appearing stereotypical/ridiculous, the consumption of sugary, high calorie comfort foods (such as ice cream) does see an increase in what are deemed 'difficult times'
- After the months of lockdown the UK (like other European nations) experienced a warm summer. These two factors compounded resulted in more people being out more frequently. In fact, Kantar calculated that in the months of June-July-August there were 12 million more ice cream consumption occasions per week than the previous year
2020 saw a boost in both home and out of home ice cream sales, it was seen as a convenient and affordable snack that had a huge variety of choice, and it was a way for consumers to have a little enjoyment in harder moments.
According to the same Kantar study, in 2020 demand for ice cream grew by 17%. The Scottish ice cream producer Mackie's was a huge beneficiary of this surge. Its sales grew by 37%, amassing over 6% of the whole British ice cream market and ranking only behind major multinational corporations.
As per Nielsen, the flavours that were most appreciated during the months of lockdown in the UK leaned toward the fruity type with coconut leading the way, followed by lychee and mango.
Demand Analysis
2.1 Seasonality and consumption habits
As mentioned earlier, summers and periods of warm weather represent the most important period for the consumption of ice cream. The particularly warm summer of 2018 saw a boost in sales which the relatively cooler summer of 2019 did not benefit. It is estimated that the period of time between mid-May and end of August represents around 50% of ice cream sales. Artisanal, off-brand and to-go ice cream producers and sellers particularly benefit during these months [GrocerUK].
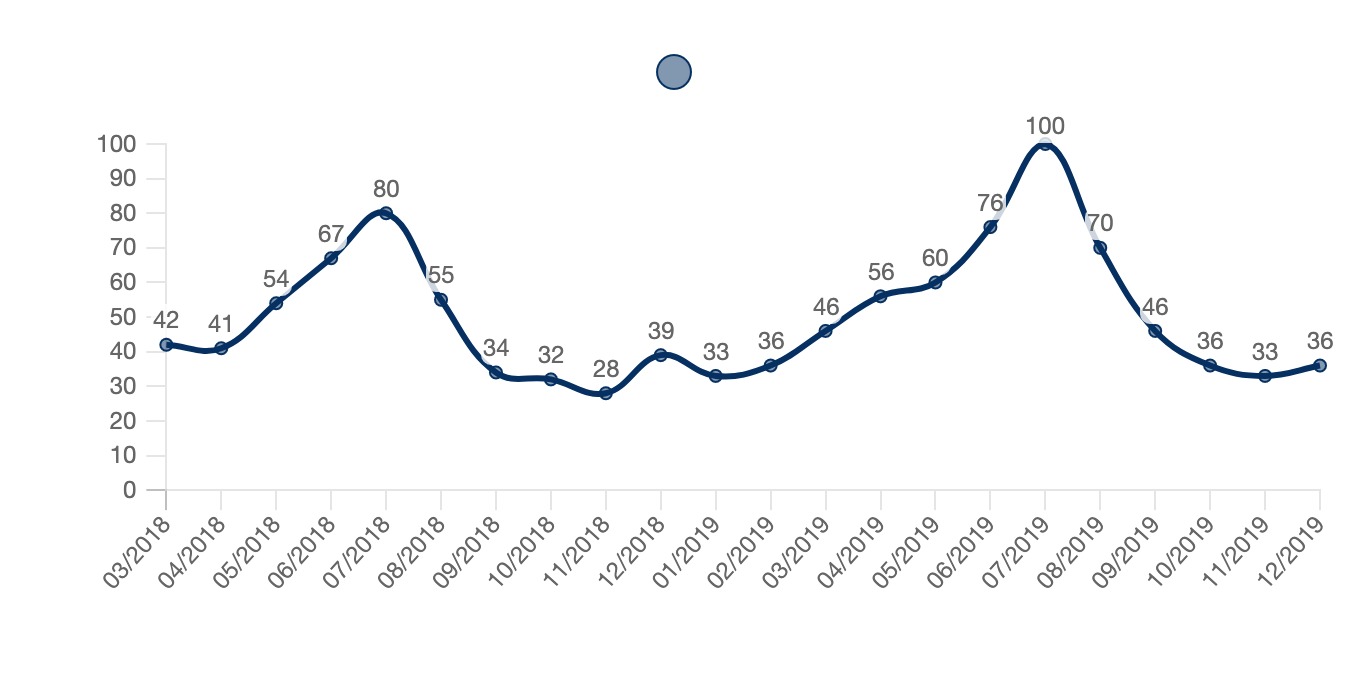
The graph below represents the proportion of searches for the term 'ice cream' in the UK since 2016, compared to when it was the most searched (when it peaks at 100). Therefore, a value of 50 means that the keyword has been used less often in the region concerned, and a value of 0 means that there is insufficient data for this keyword.
Over the last 5 years, we observe that demand has been strongly cyclical, with a peak in interest during the summer months, which is consistent with the results detailed above.
Search interest for 'ice cream'
UK, 2017-2019
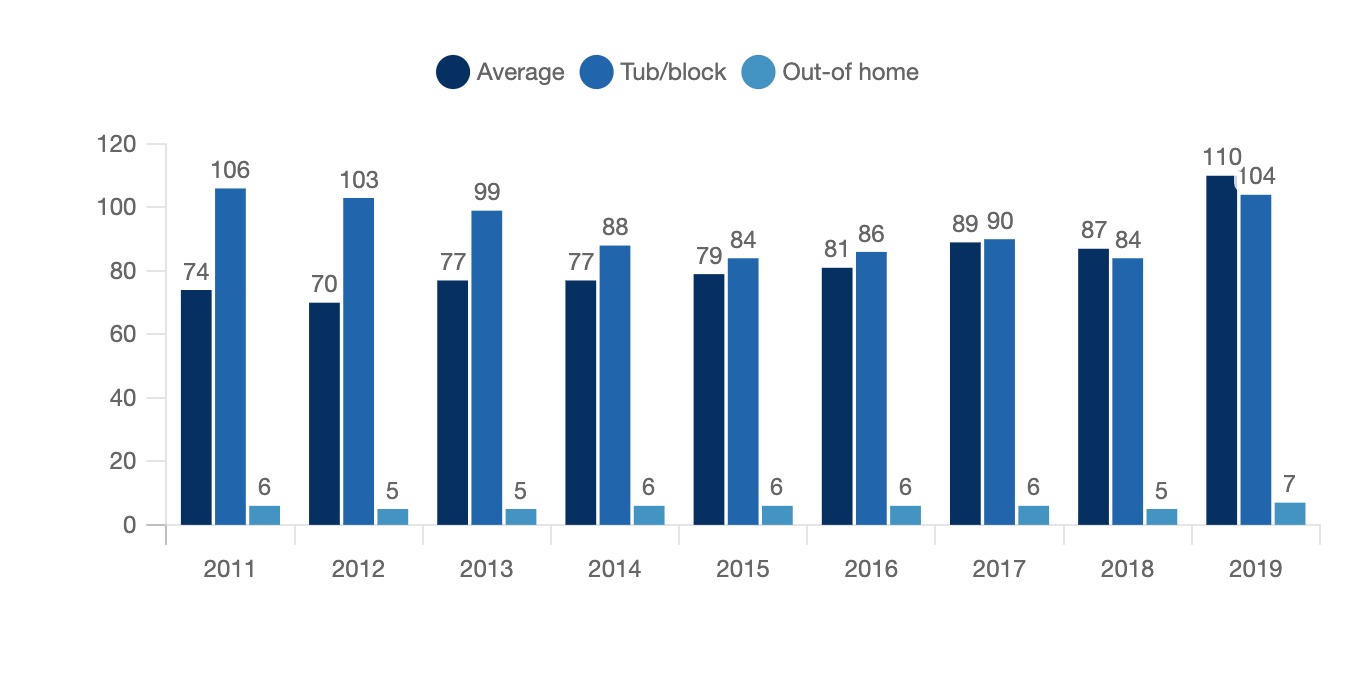
For the past decade, consumers in the UK have been eating more and more ice cream. In fact, the average purchase per person per week of ice cream (including takeaway ice cream) increased from 74 grams in 2011 to 110 grams in 2019. This trend has not been consistent regarding both the consumption of tub ice creams (which is generally done at home) and ice creams consumed outside the home (stick, take away cones/cups). Regarding tubs, the average consumption per person per week was 106 grams, while in 2018 it was 84, following years of decline. In 2019 however this figure shot up to 104 grams per week. As for ice creams consumed out-of-home, the consumption has remained rather constant fluctuation between 5 and 7 grams per person per week between 2011 and 2019.
Average purchase of ice cream, per person per week
UK, 2011-2019, grams
NB: The graph is not exhaustive, therefore the average consumption includes other forms of ice cream
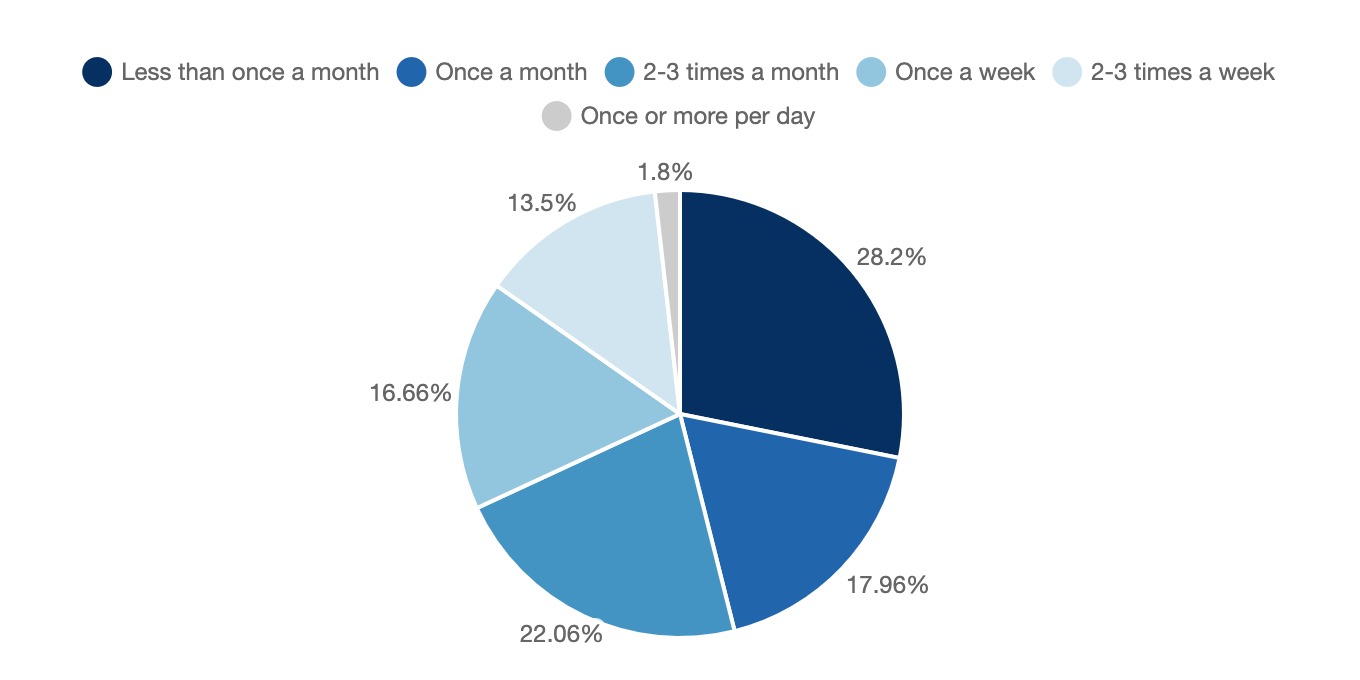
As can be seen in the graph below, the frequency of consumption in the UK is quite varied.
Consumption of ice cream, by frequency
UK, 2019, in %
Almost half of Britons consumed ice cream 3 or fewer times per month, while more than half consumed ice cream between 3 and 12 times a month.
2.2 Preferences in terms of flavours, typology, and brands
According to a recent survey by the Ice Cream Associations vanilla is overwhelmingly the preferred ice cream flavour in the UK, followed by chocolate, strawberry, mint chocolate chip and cookie dough. Ice cream sellers confirmed this preference with 84% of them stating that vanilla was their most sold flavour.
Ice creams, and therefore preference for ice cream can be classified in terms of their typology:
- Cones
- Tubs (including individual)
- Bars
- Sticks
- Mini format (bite size, bars, cones etc)
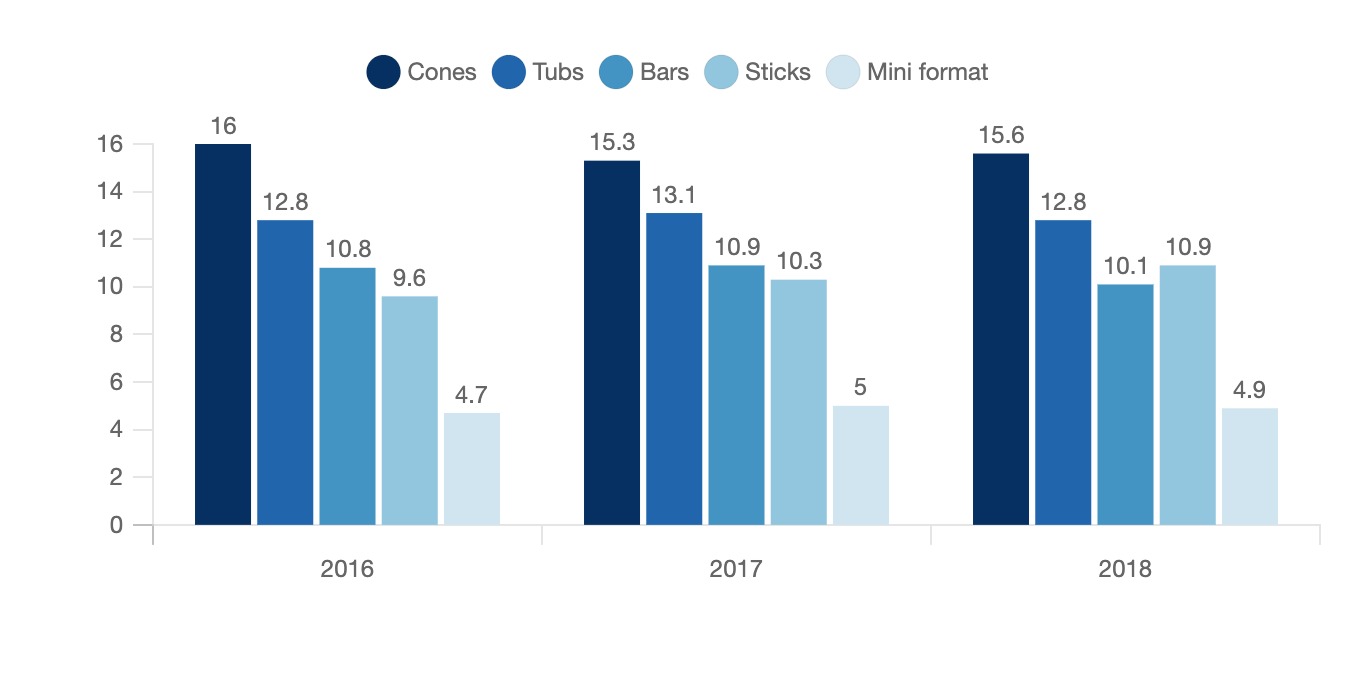
Year after year cones are the preferred type of ice cream, followed by tubs, bars, stick, and the mini format.
Preferred type of ice cream
UK, 2016-2017, in millions of users
While the preference for ice cream in the form of cones, tubs and mini-format has remained relatively constant with minor fluctuations, bar ice creams have steadily become less popular, with sticks seemingly gaining.
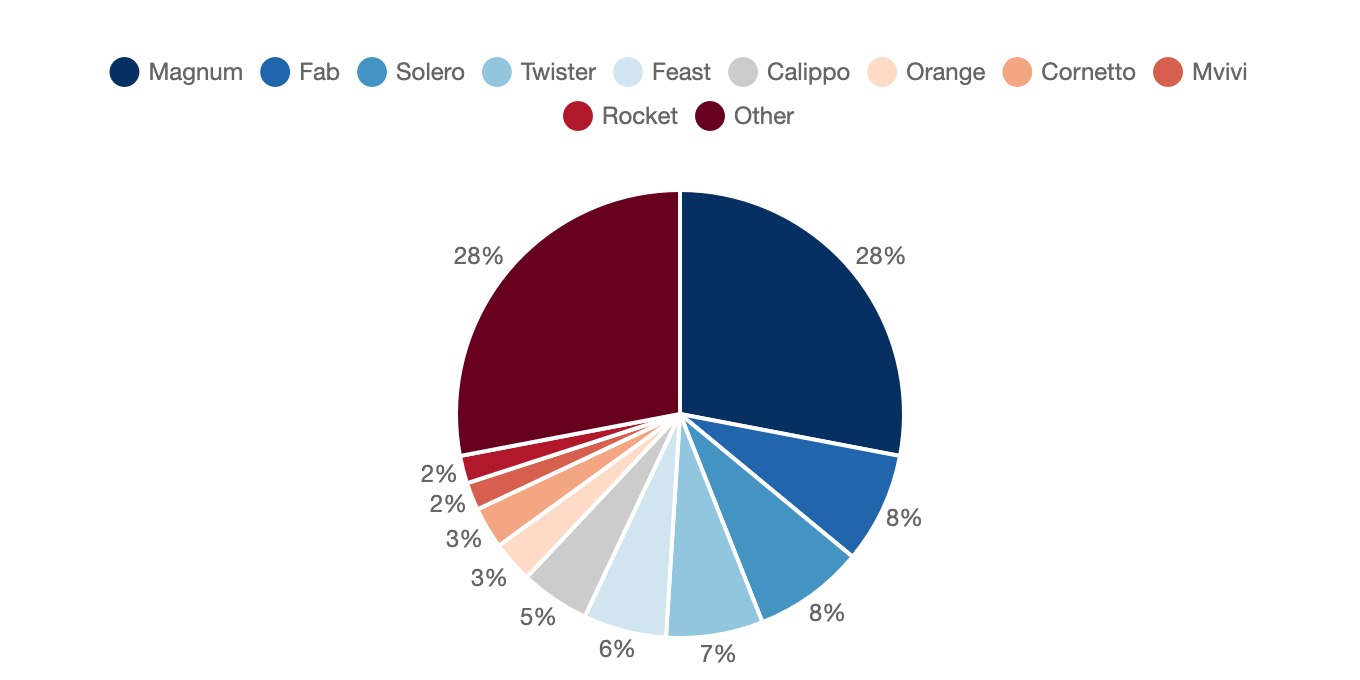
When speaking of preferred brands, Britons seem to have a high degree of preference within each type of ice cream. Yougov ran a poll to determine the favourite 'ice lolly' in the UK. While 'ice lolly refers' exclusively to "products made from mainly fruit juice or puree, water and sugar but may include flavour, flavouring or colours and have minimum fruit content for non-citrus fruits of at least 15% and for citrus fruits of 10%", the options presented by the questionnaire included ice creams that do not fit this description. Based on the options presented it can be assumed that it referred to all hand held ice creams (which includes cones, bars, sticks etc). Magnum is the preferred ice lolly in the UK, being the favourite for over a quarter of Britons.
Favourite ice lolly
UK, 2019, in %
Age appears to play a role in terms of appeal with only 12% of 18-24 year olds approving of Magnum but more than 40% of over 65s choosing this as their favourite.
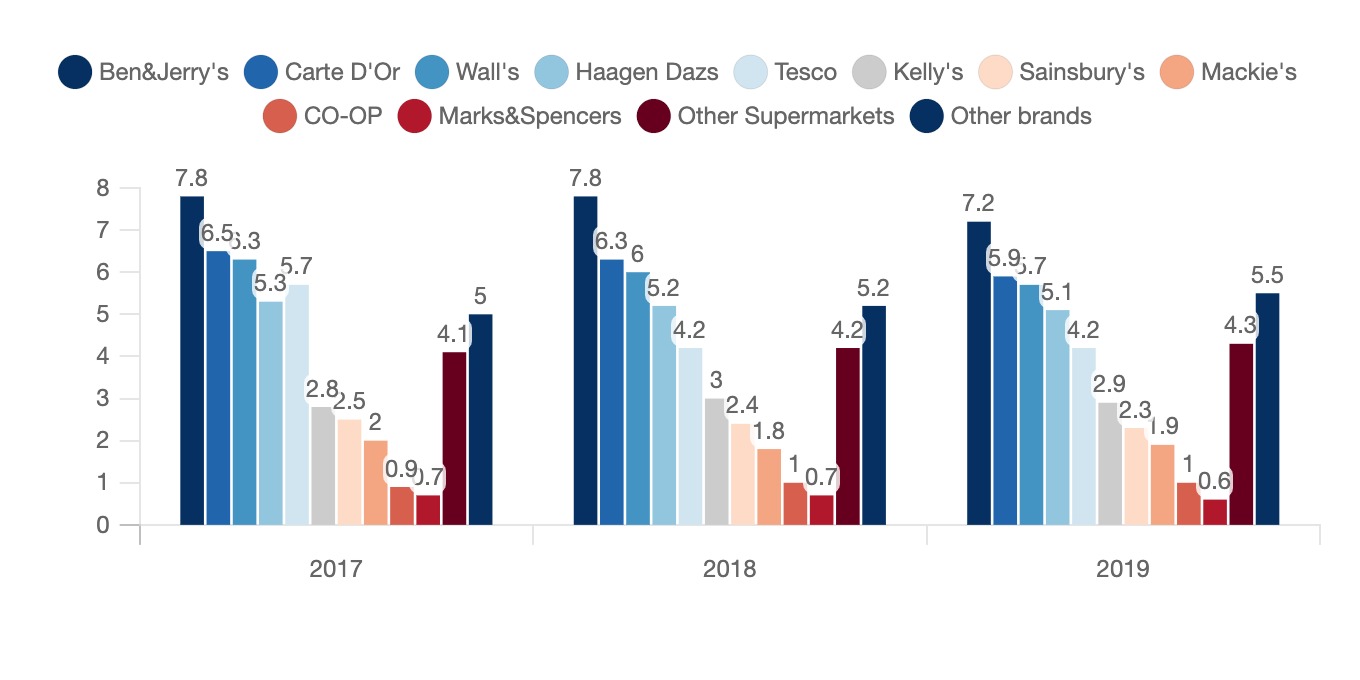
When speaking of ice cream in tubs (including individual) the favourite brands are different. Ben&Jerry's, Carte D'Or, Wall's and Haagen Dazs are the preferred ones, but supermarket ice cream such as Tesco's, Sainbury's and The Cooperative (COOP) are also really appreciated.
Most consumed tub ice cream brands
UK, 2017-2019, in millions of consumers
NB This graph is not exhaustive as other brands are also consumed
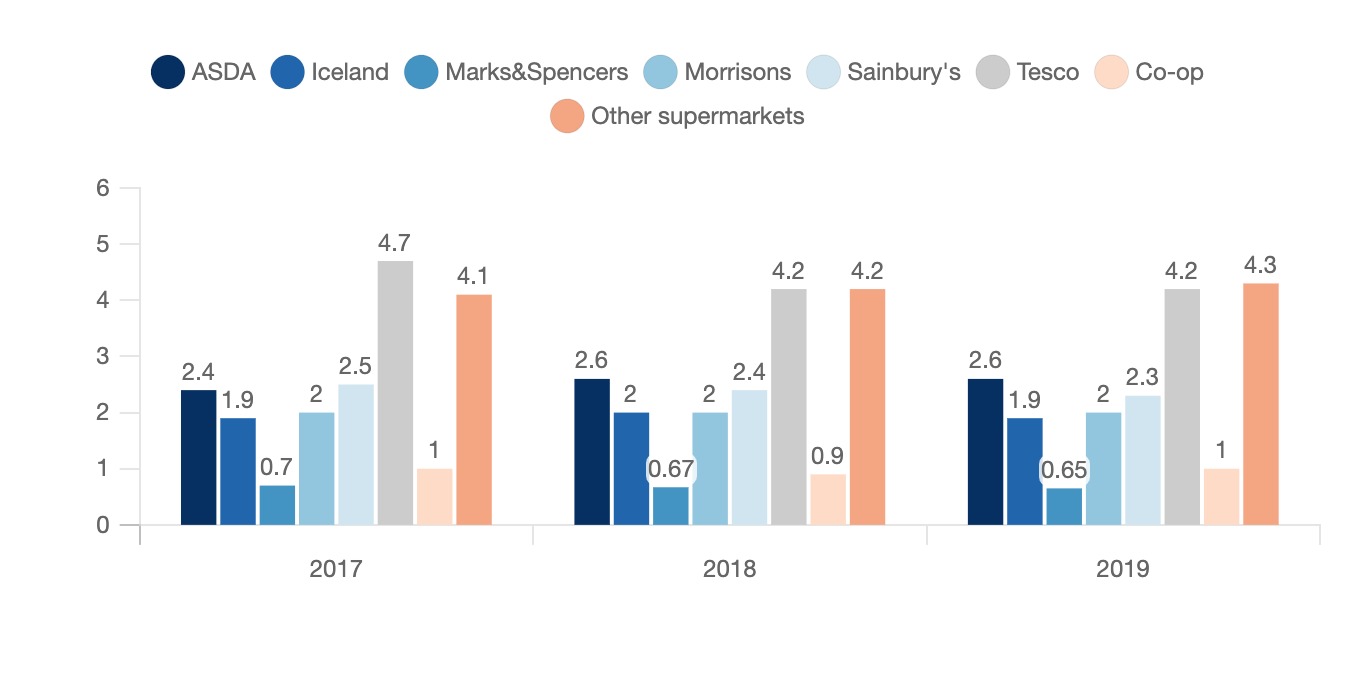
Supermarket branded ice creams (tubs) are quite popular in the UK with over 7 different supermarket chains having significant customers for this product. However, the number of people buying supermarket-branded ice cream has remained constant, with better known brands, artisanal ice cream makers and franchises such as Amorino or Grom increasing their customer base.
Consumptions of supermarket-brand tub ice cream
UK, 2017-2019, in millions of consumers
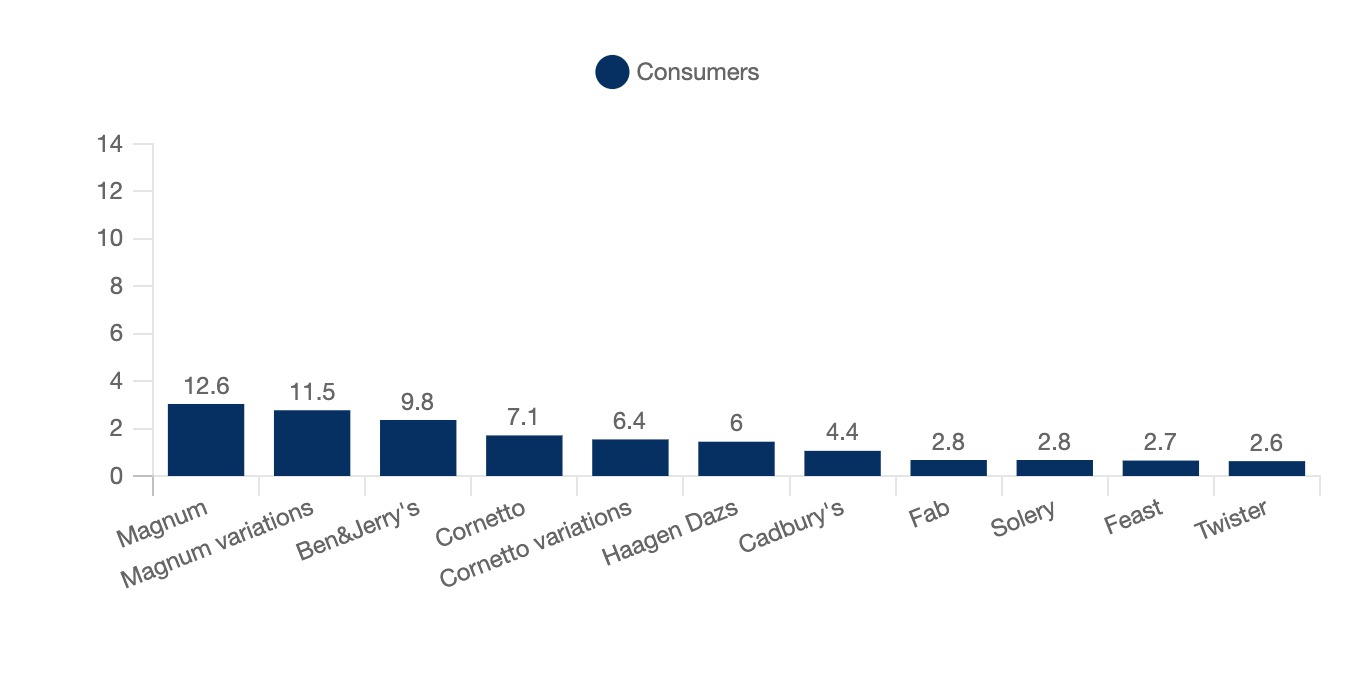
Regarding all typologies of ice cream, the classic Magnum (hard chocolate outside with cream inside) appears to be the brand that is consumed by most Britons, followed by other types of Magnums (caramel or fruit variations), then by Ben&Jerry's, classic Cornetto, other Cornetto variations and Haagen Dasz.
Most consumed ice cream brands (all typologies of ice cream)
UK, 2019, in millions of consumers
NB This graph is not exhaustive, there are tens of brands of ice cream in the UK that are consumed each year, this graph represents only the top 11
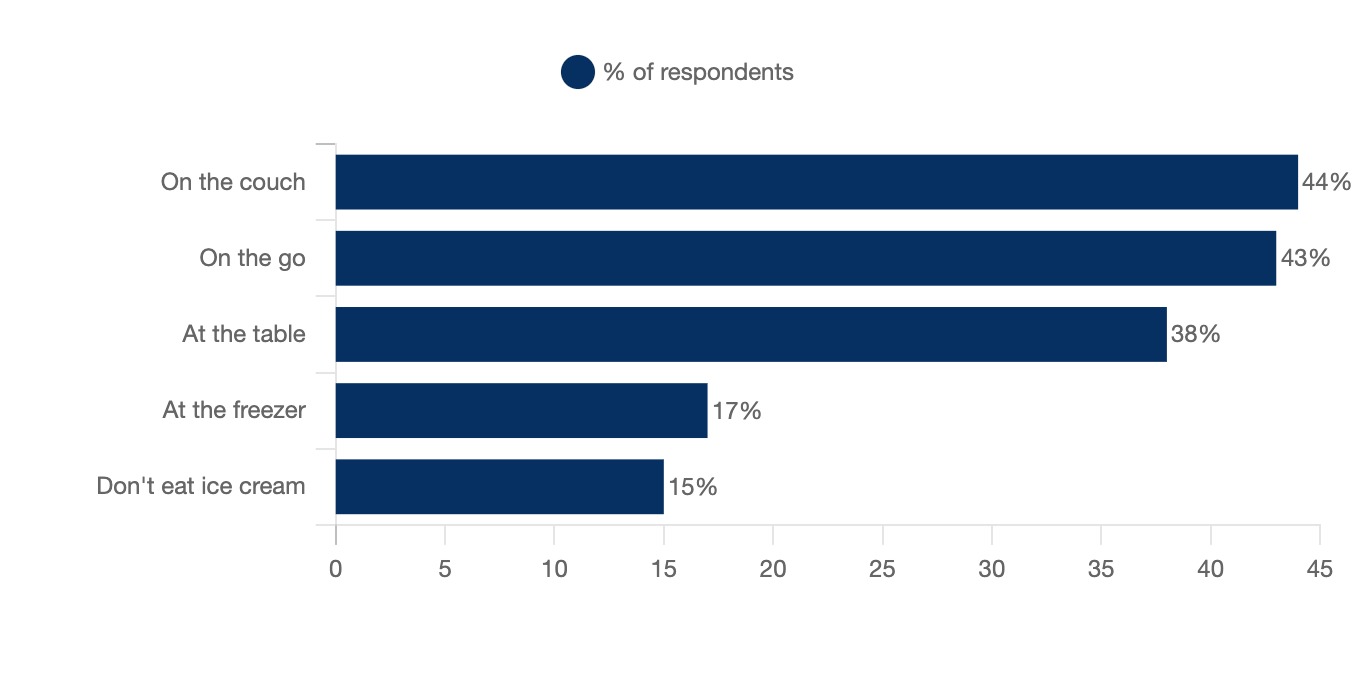
2.3 On the couch, on the go & at the table: where Britons eat their ice cream
In a survey conducted by TheGrocerUK, it was revealed where British people consume their ice cream. 5 situations/locations were possible answers to this survey (couch, table, on the go, at the freezer, don't eat ice cream). Respondents could pick more than one answer as they were not mutually exclusive. Over 40% of responders said they eat their ice cream on the couch or on the go, while 15% said they don't eat ice cream.
Where Britons eat their ice cream
UK, 2017, in % share of respondents
It is important to note that answers were not mutually exclusive and respondents could choose more than one answer, which explains why the total percentages surpass 100.
2.4 Latest trends in demand
The latest consumer trends are quite varied concerning the ice cream market in the UK: they range from nutritional characteristics, to flavour, to typology of ice cream and much more.
As one may expect, as more people become acutely aware of their diets, a shift toward lower-calorie, low sugar, no preservatives/colourants ice cream has been taking place. Brands such as Halo saw a CAGR of 462% in their low calorie ice cream in the years 2013-2018 [Callebaut; Interlevin].
An increase in appeal of non-dairy ice cream has also taken place over the last few years with 17% of UK adults saying they avoid consuming dairy altogether and 11% saying they have avoided eating dairy in the 3 months prior [Callebaut].
47% of ice cream consumers in the UK have also expressed openness/favourability towards the possibility of customised ice cream (such as sprinkles, M&Ms, chocolate or caramel drizzle, inclusion of waffles or cookies etc) [Callebaut].
Handheld format ice creams are also increasingly appreciated for two reasons: they can be eaten in one sitting but also while moving. In fact, 58% of ice cream consumers in the UK stated that they appreciated a product that can be consumed 'on the go' [Interlevin].
Premium ice creams have also seen a huge surge in popularity with 87% of ice cream shoppers revealing that they would be willing to pay more if the ice cream they consumed was of superior quality (with the best ingredients, fancy packaging etc) [Frozen Food]
Ice creams including high quality fresh fruit are also increasingly sought after. In fact, Haagen Dasz saw success with its 'Fruit Obsessions', which comes with peach, raspberry, and mandarines, seeing a repeat purchase rate of almost 30% (which is quite high for new flavours).
2.5 The incessant growth of vegan & plant-based
The desire for plant based & vegan ice creams are increasing worldwide
Consumers in the UK are becoming more and more conscious about what they eat and this is no different regarding their ice creams.
In the UK, the vegan ice cream market is expected to show a swift CAGR of 7% for the years 2020-2026. The main factors pushing this trend are health, ecological/environmental concerns, and animal treatment concerns among others. The median age is increasing, and older people are generally more aware and careful about their diet. This segment of the population is also more inclined to spend higher amounts of money on better quality food. This trend is also reflected by the increasing offer in both supermarket aisles and individual shops [OMR Global].
There is serious competition regarding this specific sector of the ice cream market. This is due to a lower degree of differentiation between products, similar prices between products (therefore low switching costs) as well as a volatile market [OMR Global].
According to Mintel's Global New Product Database, new vegan ice cream launches accounted for 7% of all new ice cream launches in the UK in 2019/20. This represents a large share of a newly emerging market, and a huge increase compared to just 3% in 2015/16. Additionally, since the advent of the COVID-19 pandemic 12% of adults in the UK (that were not previously vegan) agreed that a vegan lifestyle was more appealing. This figure was almost double (23%) among under-25s [Mintel].
Within the vegan ice cream sector there has been a recent focus on texture, with consumers preferring ice creams with 'chunky' textures such as toffee pieces, nuts, cookie or dough pieces. These type of ice creams have increased from 2% of new product launches in 2016/17 to 13% of new product launches in 2019/20, within the vegan ice cream sector. This shift to textured ice creams is not exclusive to vegan ice creams with 73% of UK ice cream consumers affirming their appreciation of ice creams with different textures.
Flavour preference regarding vegan ice creams is not the same as the general preferences of ice cream in the UK. Chocolate is the first choice of consumers with 26%, followed by vanilla at 11% and coconut at 9% [Mintel].
Regarding newly launched products within the ice cream market (can include flavour, new shape of ice cream, new texture, new consumption experience etc) vegan was by far the most appreciated with 36% of Britons affirming this is the one they value the most, followed by bubble gum flavoured ice cream at 9% and dairy and sugar-free both at 5% [Dairy Reporter]
Market structure
3.1 Main players
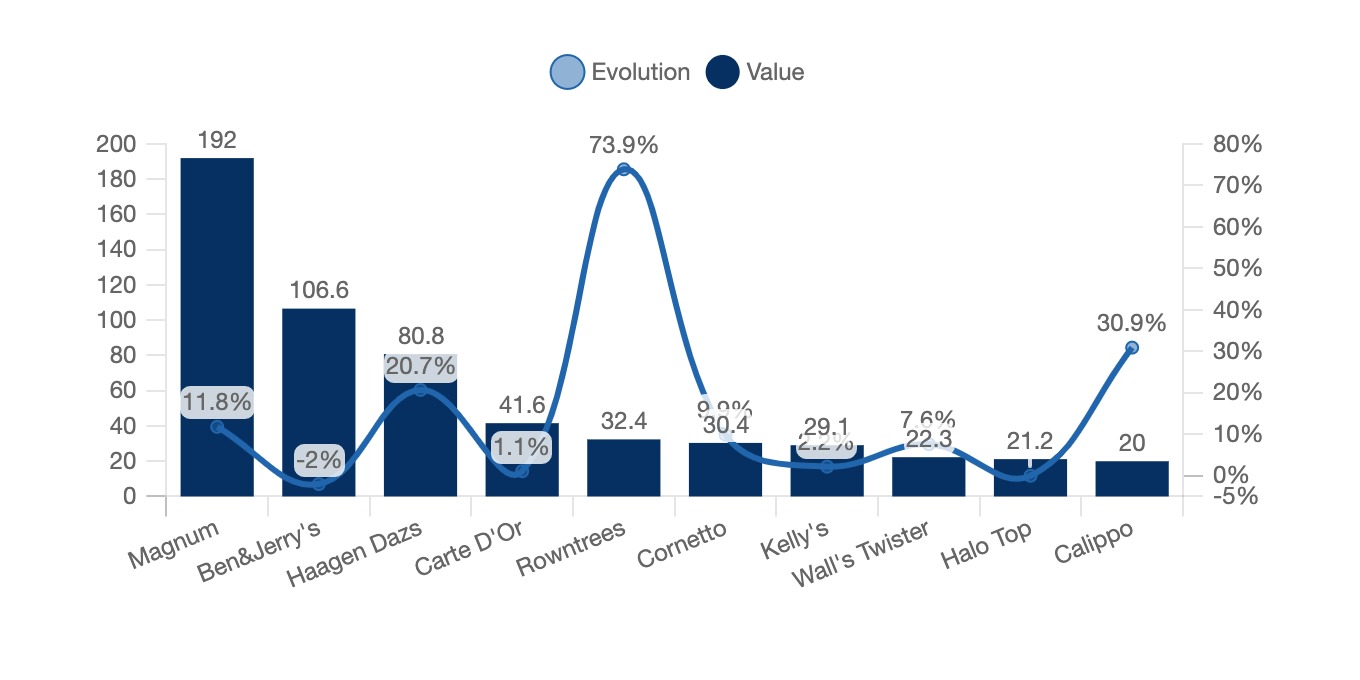
The ice cream market in the UK is dominated by well known international brands, which are part of large global groups. In 2019 the most valuable brands were Magnum, Ben&Jerry's, Haagen Dasz and Carte D'Or.
Most valuable ice cream brands and year-on-year growth
UK, 2019, in millions of £ and %
NB The growth for Halo Top from 2018 to 2019 was of over 1.800% which could not be included in the graph
Three of the most valuable brands in 2019, Rowntrees, Halo Top and Calippo were not in the ranking for 2018 and experienced huge growth. This demonstrates a certain degree of openness to new players. Halo Top specialises in low-calorie products and is the main player for this type of product. Additionally, its products were exclusively sold at Tesco [Kantar].
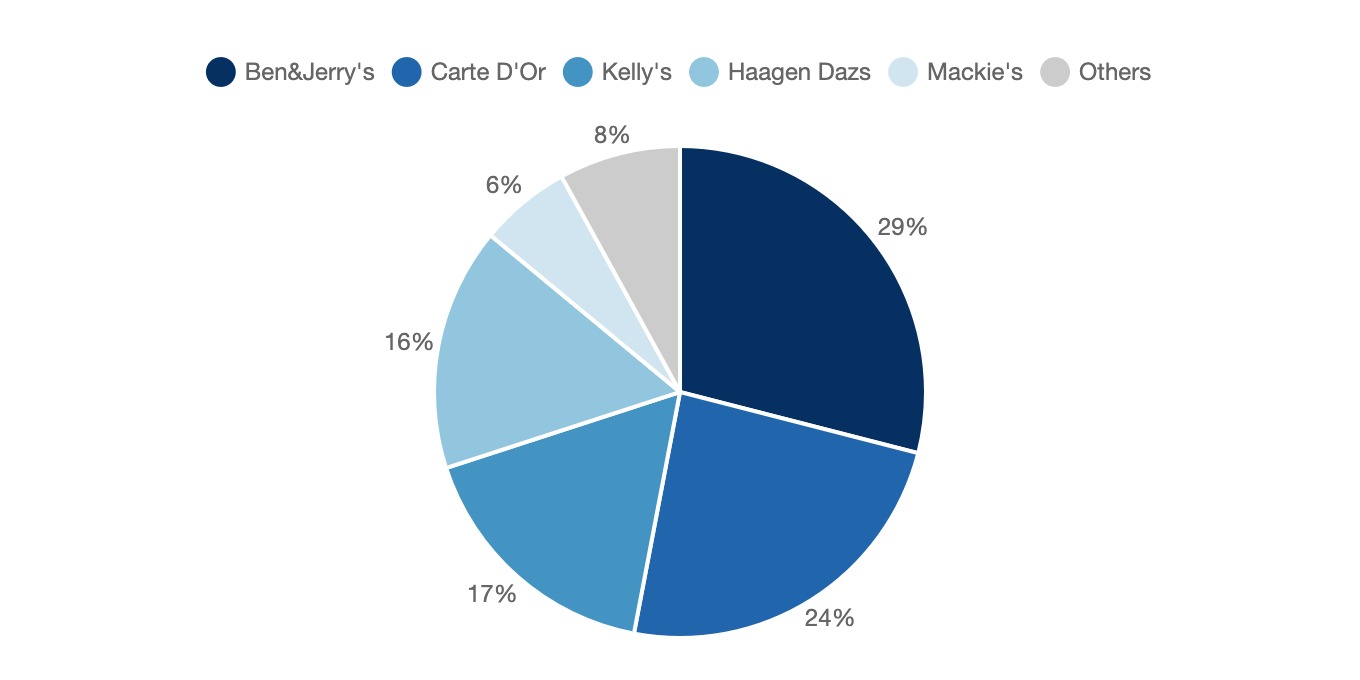
In terms of market share regarding premium ice cream six brands hold an overwhelming majority of this market.
Market share of premium ice cream
UK, 2019, in %
It is important to note that Mackie's control 25% of the market share in Scotland, indicating territorial loyalty (Mackie's is a Scottish family run company).
Many of the most valuable and best-selling brands are parts of big international groups. For example, Magnum, Cornetto and Calippo are all part of the Unilever group, while Kit-Kat, Smarties, Oreo and Milka are part of the Froneri group. Froneri was born in 2016 out of Nestlé's desire to divest part of its ice cream business in some 20 countries by moving closer to R&R, a subsidiary of an investment fund named PAI Partners. Froneri continued to grow, and in 2019 Nestlé announced that it had sold its US ice cream business to Froneri for $4 billion.
The brands of the main groups
| Froneri |
Dairy
Kit Kat
Extreme
Nuii
Oasis Sorbet
Pirulo
Nestlé Ice Creams
Smarties
Mystery
Oreo
Milka
Suede
|
| Unilever |
Magnum
Gold Card
Cornetto
Viennetta
Calippo
Ben
Kinder Ice Cream (with Ferrero)
|
| General Mills |
Häagen Dazs |
| Mars |
Mars
Snickers
M
Twix
Bounty
|
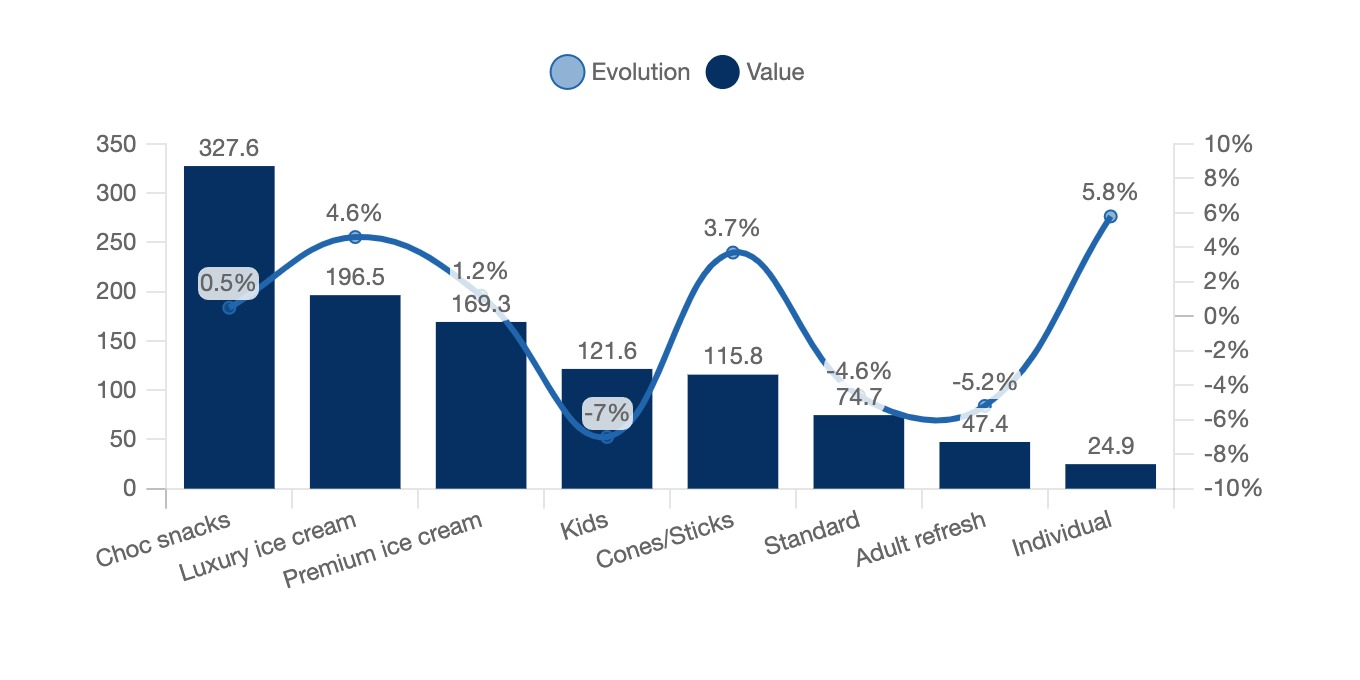
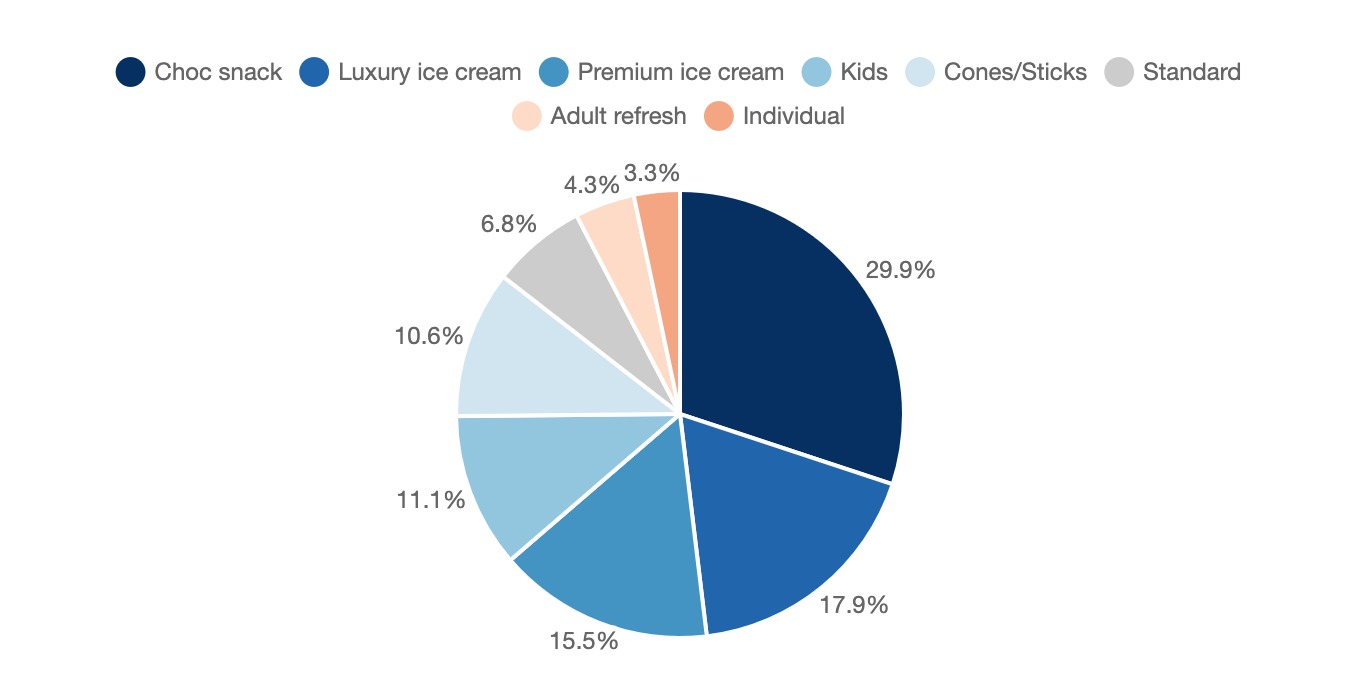
In the UK the ice cream market can be categorised in 8 segments
- Choc snacks
- Luxury ice cream
- Premium ice cream
- Kids
- Cones/Sticks
- Standard
- Adult refresh
- Individual dessert
Value and evolution of ice cream segments
UK, 2019, in millions of £ and %
Market share of ice creams, by segment
UK, 2019, in %
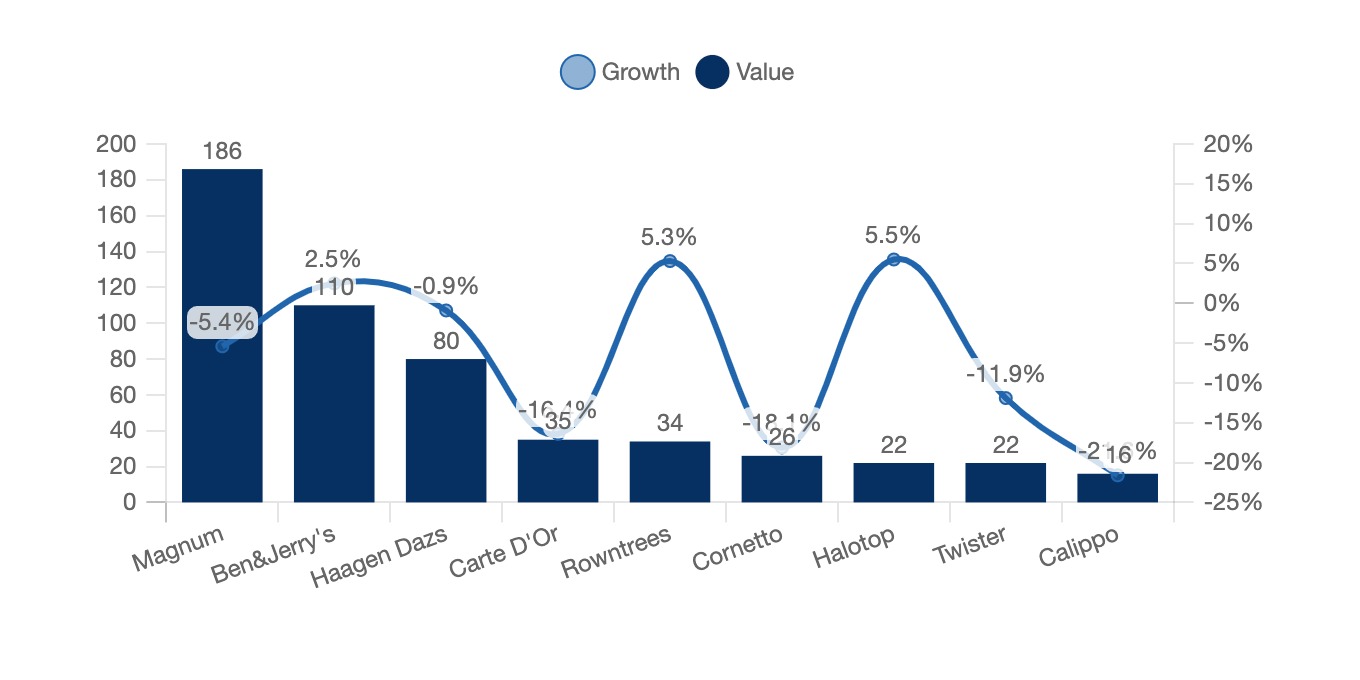
2019 (with a summer that was comparably cooler than 2018) also saw some declines for brands which focus on handheld type of ice creams. Calippo incurred a year-on-year decline of 21.6% while the Cornetto's decline was of 18.1%. Brands which focused more on pot/tub ice cream did not record losses and actually gained, such as Ben&Jerry's which saw a growth of 2.5% in 2019.
Ice cream brands value and year-on-year growth
UK, 2019, in millions of £ and %
As it can be seen from the graph above, brands that mainly sell pots and tubs of ice cream such as B&J's, Rowntrees and Halotop grew. Meanwhile, other brands that sell handheld ice cream fared much worse.
3.2 Value chain

Source: Ice Cream Producer's Association
The challenge in the production and distribution of ice cream and sorbets is not to break the cold chain. Products must be kept at a temperature of -18 °C or below. Ice creams or sorbets must be kept at -18 °C until they are delivered to the consumer.
3.3 Production
The production of ice cream is structured around 5 steps:
1) The different raw materials (milk, flavor, fruits) are mixed and then pressurised. The mixing is carried out at a temperature of -5°C.
2) The mixture is churned slowly for about 12 hours in order to make the "ice cream" homogeneous.
3) Then comes the pre-freezing stage which consists in solidifying and aerating the mixture.
4) The mixture is frozen in order to finish solidifying the ice. This is known as the forming.
5) The ice cream is placed in a temperature of -18°C and will be kept under this temperature.
Industrialists are investing to increase their means of production
To keep up with the increase in demand, manufacturers have invested in their production facilities. One example is General Mills, which increased its capacity by 15% for Häagen Dazs. These increases in capacity are to be compared with the increase in exports. Domestic production capacities are increasing to cover for British demand but also to satisfy the export ambitions of producers.
Manufacturers are also investing in qualitative production means. Consumers value the taste and appearance of artisanal ice cream. Manufacturers are also adapting their production by segmenting their capacities between classic ice cream and "old-fashioned" or "traditional" ice cream. This evolution implies changes in the processes of mixing ingredients (more pieces) or shaping (more airy, creamy ice cream).
In 2020 in the UK there were 355 ice cream manufacturing businesses, which employed 3.657 individuals [IbisWorld]
There are estimated to be around 1000 artisanal ice cream manufacturers in the UK [Marketing]
3.4 Distribution
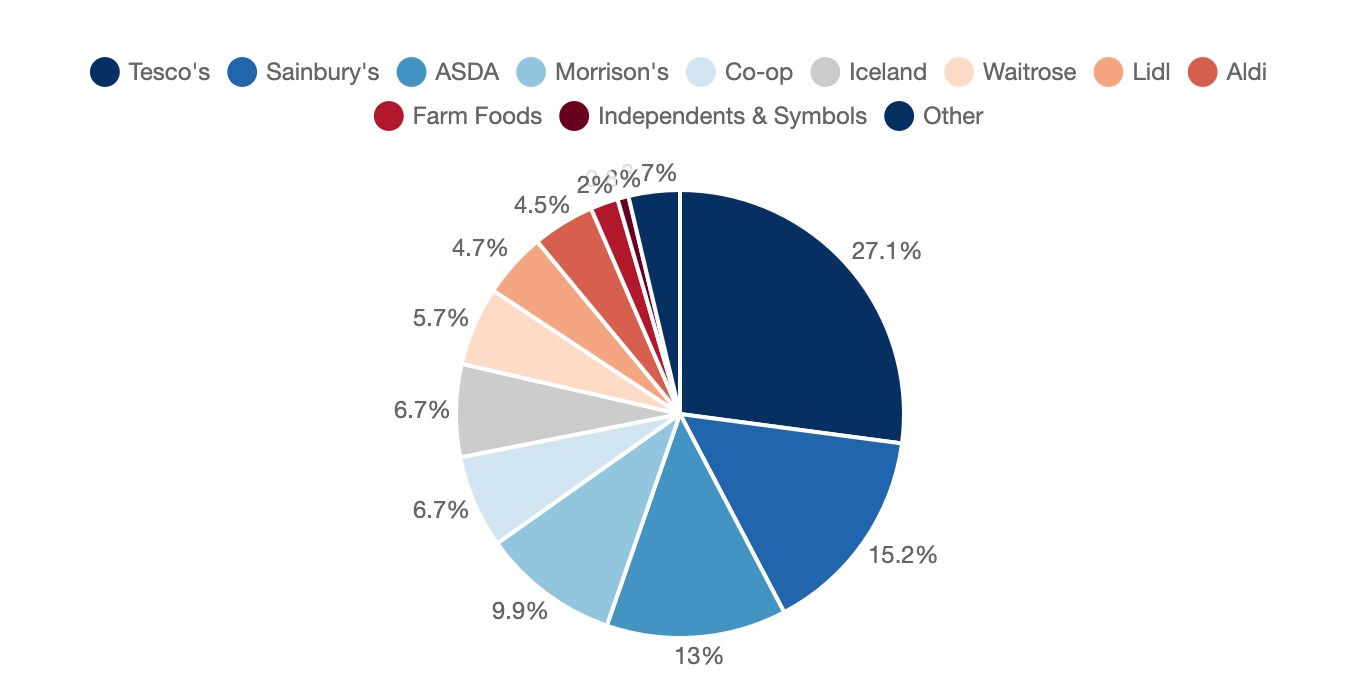
In the UK the distribution and sale of ice creams is highly concentrated. In fact, mass retailers buy almost 96% of the production of ice cream in the UK. Tesco is the main seller with 27.1% of market share, followed by Sainbury's with 15.2% and ASDA with 13%.
Market share of ice cream distribution
UK, 2019, in %
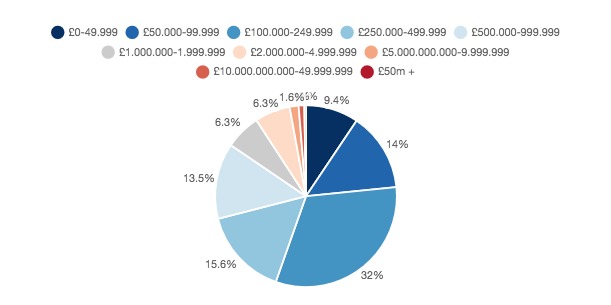
3.5 Different sized manufacturers
In the UK, ice cream manufacturers can be categorised by their overall turnover. A large minority finds themselves between the £100.000-£249.999 annual turnover. In 2020 there were no manufacturers with a turnover superior to £100 million.
Share of ice cream producers by annual turnover
UK, 2020, in %
Analysis of the offer
4.1 A huge and varied offer
The structure of the offer
The ice cream and sorbet market offers a wide range of products, differentiated by many factors:
Flavour;
Typology;
- Cones
- Tubs (including individual)
- Bars
- Sticks
- Mini format (bite size, bars, cones etc)
Segmentation;
- Choc snacks
- Luxury ice cream
- Premium ice cream
- Kids
- Cones/Sticks
- Standard
- Adult refresh
- Individual dessert
Vegan/plant-based or not;
Artisanal or industrial and many more.
Nevertheless, despite this great diversity, a large part of the market is concentrated between few types of products. As seen above, cones are by far the most popular format, with stick and bars also being largely appreciated in the UK. This signals towards consumers preference in single sitting consumer products that can be eaten on the go. Vanilla is an overwhelming favourite regardless of typology of ice cream.
Overview of the main types of products
Individual ice cream
Individual ice creams include cones, sticks, ice cream tubes and mini formats. There are several brands such as Magnum, Cornetto, for Unilever. Wall's produces its very famous Twister


Ice cream to share
These are the more copious formats such as ice-cream cakes or party ice cream like logs. The best known brands are, Nestlé Signature, Vienneta or Carte d'or.


Tubs (including individual)
These are ice cream containers of about 1L for the tubs and between 100ml and 500ml for the individual ones in which you have to dig with a spoon (that is sometimes provided). The best known brands are Carte d'Or, Häagen Dazs and Ben&Jerry's. Supermarket brands are also popular in this type of ice cream.


Artisanal ice creams
Artisanal ice cream is the smallest segment in terms of volume but also the most diversified. These come in a variety of formats, but most often they are in the form of tubs but also take-away (cones, pots) at artisanal ice cream makers. The artisan can also decide to package his/her product to sell it more easily to consumers. Due to the nature of the craft, there are no brands of artisanal ice cream that stand out, each artisan bringing their own local "brand".
4.2 Prices and production costs
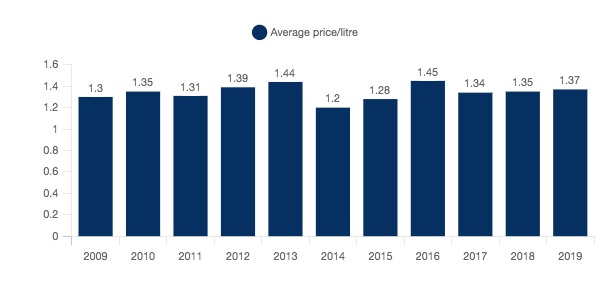
From 2009 to 2019 in the UK, the average price for ice cream has fluctuated. Over this period of time the average price per liter of ice cream was £1.34, peaking in 2016 at £1.45 per litre and hitting a low of £1.2 per liter in 2014.
Average price per litre of ice cream
UK, 2009-2019, in £ per litre
Prices for individual types of ice creams vary according to ice cream but also based on geographic location (one can imagine that an ice cream in central London will cost more than the same one in a small countryside village).
| Product |
UK Retail Price |
Price in Dorset local supermarket |
Small store in Manchester |
Price in Central London (average) |
Price in highway gas station near Derbyshire |
Average |
| Magnum classic |
£1.93 |
£2 |
£1.89 |
£2.49 |
£1.90 |
£1.90 |
| Twister (S&L) |
£1.16 |
£1.40 |
£1.19 |
£1.59 |
£1.15 |
£1.15 |
| Calippo orange |
£1.14 |
£1.30 |
£1.29 |
£1.59 |
£1.16 |
£1.05 |
| Feast |
£1.11 |
£1.30 |
£1.39 |
£1.79 |
£1.20 |
£1.14 |
| Magnum almond |
£1.97 |
£2.00 |
£1.89 |
£2.49 |
£1.90 |
£1.96 |
| Solero exotic |
£1.44 |
£1.80 |
£1.39 |
£1.89 |
£1.49 |
£1.49 |
Source: Better Retail
NB The average is calculated taking into account multiple other locations that are not displayed in this table
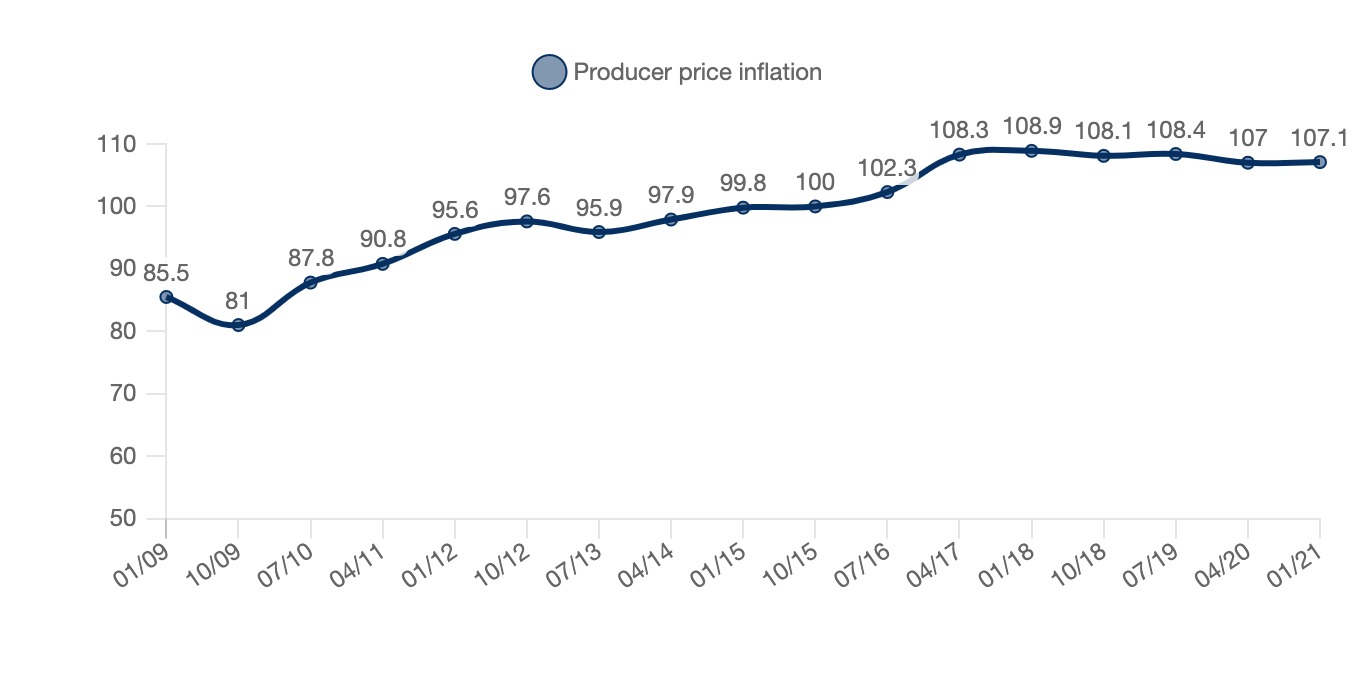
When speaking of the cost of production for the same time period (however, up to January 2021) production costs have been increasing. Using the code MM23 on the Office for National Statistics website, which corresponds to ice cream, the producer price inflation over time can be observed.
Producer price inflation
UK, 2009-2021, base 100 in 2015
An initial decrease in production costs could be observed in 2009 and since then there has been a steady increase which has been constant and persistent up until January of 2021.
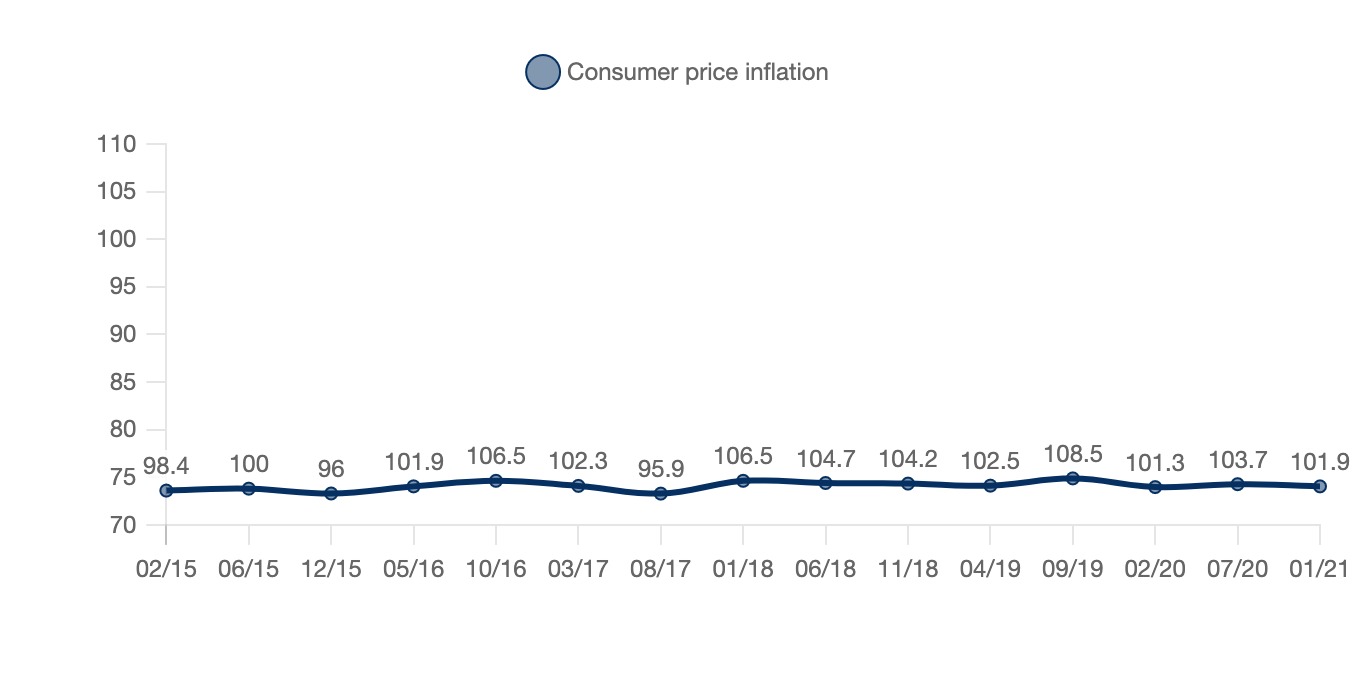
In parallel, it is also interesting to see how consumption costs have fluctuated.
Consumer price inflation
UK, 2015-2021, base 100 in 2015
Regulation
5.1 Production regulations
UK regulations, in accordance with the Ice Cream Alliance (main ice cream association in the UK), set out very clear specifications for what qualifies as ice cream, dairy ice cream, sorbet etc.
Ice creams are exclusively categorised as a frozen product containing a minimum of 5% fat content and no less than 2.5% milk protein 'not necessarily in natural proportions'. It is manufactured through the emulsion of milk solids, sugar and fat (sweeteners authorised by the Miscellaneous Food Additives and the Sweeteners in Food Regulations Act of 2007 are allowed). This mixture must also be subjected to heat treatment. The addition of additional food substances (fruit, chocolate, cookies etc) is permitted. Up until Brexit these were complemented by EU Regulation 1333/2008 which took into consideration health concerns for consumers, producers and environmental standards.
Dairy ice creams follow the same regulations as ice cream, however, the fat content must exclusively be of milk fat (and no other type of fat). These type of ice creams can include other ingredients which are not based on milk fat that are used in ice creams (flavouring, emulsifier, eggs etc).
Milk ice are products which contain a minimum of 2.5% dairy fat and at least 6% milk solids (not fat), 'excluding any other fat or protein from a non-dairy souce'.
Ice lolly/water ice are products whose main ingredients are water and sugar. These can include flavourings and colourants
The denomination of sorbet is maintained exclusively for products which contain a maximum added fat content of 1%. This type of product must contain 'when reference is made to fruit(s) or vegetable(s) in words, definitions, trade-marks, brand name, pictorial matter or symbols, the fruit(s) or vegetable(s) content must be at least 20%. When the concerned fruit is of the citrus variety, the content can be reduced to 15%. The case is the same for other acidic fruits such as pineapple, corossol, cherimoya, guava, kiwi, lychee, passion fruit etc. The minimum content is reduced to 7% for nuts and nut preparations.
Source: Ice Cream Alliance
5.2 Selling regulations
To sell ice cream (as an individual seller outside of mass retailing) a specific licence is needed.
- If an ice cream shop has chairs on the sidewalk or pavement a street trader's licence is needed
- If you are a vendor from a bicycle, motorcycle or four-wheel vehicle the same licence is needed (street trader), the case is the same for kiosks and mobile stalls
- If you are selling your own ice cream at a market you need a market trader's licence
- If you are selling ice cream on private land you don't need any license as long as you are at least 7 metres away from any public road or highway (landowner permission is required)
Source: Park Insurance
If you sell ice cream from a moving vehicle, and you have chimes, regulations are quite strict.
- Your chimes cannot be played at more than 80 decibels and cannot be played more than two times per hour on the same street
- Chimes cannot be longer than 12 seconds and cannot be played within the sight of any other ice cream selling vehicle
- The interval between chimes must be at least 2 minutes
- Chimes cannot be played within 50m of schools (during school hours), schools or churches (on Sunday, other places of worship as well although the regulation is not as specific)
Source: Park Insurance
Businesses that sell ice cream must comply with the Food Standards Agency (FSA) food and health regulations known as (HAACP). Visit from inspectors are regular and thorough
Selling businesses must also comply with employment regulations which include:
- Health and safety protocols
- Following the Employment Rights Act
- Liability insurance
- Minimum wage
Positioning of the players
6.1 Segmentation
| Segmentation |
Brand |
Annual turnover (millions of euros) |
| Major industrial groups |
Unilever |
50 700 (2020) |
| Nestlé |
91 400 (2018) |
| General Mills |
15 750 (2017) |
| Mars |
35 000 (2018) |
| Individual manufacturers |
Mackie's |
16 (2019) |
| Supermarkets |
Tesco's |
53 000 (2020) |
| Sainbury's |
28 400 (2020) |
| Waitrose |
6 400 (2019) |
| ASDA |
23 000 (2019) |
| Co-op |
1 500 (2019) |
| M&S |
10 200 (2016) |
| Aldi |
91 000 (2016) |
Companies

Unilever
DUNS: 552119216
Turnover:
60.1 billion € (2022)
Description:
Unilever is a British and Dutch transnational consumer goods company with headquarters in London (UK) and Rotterdam (Netherlands). The company is the world's fourth-largest food group in terms of sales, and owns several brands in the make-up and cosmetics sectors. Its products include food and beverages (around 40% of sales), household products and personal care products. One of the oldest multinational companies, Unilever's products are available in some 190 countries.
The company has over 400 brands organized into four main categories: Food, Refreshments, Home Care and Beauty.
In 2000, Unilever acquired Ben.
External Sources and News:
- with sales of over 1 billion euros, Magnum is one of the world's leading ice cream companies
- World leader in ice cream almost everywhere in the world
- Ice cream is one of Unilever's five strategic categories, along with beauty (Dove, Sunsilk...), hygiene (Rexona, Signal...), home care (Omo, Cif...) and food (Knorr, Maille, Amora...).
- Ice cream division 6.9 billion euros in sales by 2021
- 35 brands, including Magnum, Ben & Jerry's, and Wall's, each with over €1 billion in sales, and smaller brands (Cornetto and Viennetta, the American Talenti)
- Viennetta launched in China
- ice cream accounts for 15% of the global snacking market.
Data:
DUNS: 552119216
Legal Name: UNILEVER FRANCE
Address: 20 RUE DES DEUX GARES , 92500 RUEIL-MALMAISON
Number of employees: Entre 1 000 et 1 999 salariés (2018)
Capital: 28 317 129 EUR
Financial Data:
| Year |
Turnover (€) |
Net Profit (€) |
Fiscal Year End |
Fiscal Year Duration |
| 2019 |
2 201 159 745 EUR |
63 473 694 EUR |
31/12/2019 |
12 |
| 2018 |
2 336 274 317 EUR |
114 455 373 EUR |
31/12/2018 |
12 |
| 2017 |
2 404 932 273 EUR |
-49 480 460 EUR |
31/12/2017 |
12 |
| 2016 |
2 484 559 554 EUR |
-73 923 515 EUR |
31/12/2016 |
12 |
| 2015 |
2 560 487 335 EUR |
75 842 155 EUR |
31/12/2015 |
12 |
Company Managers:
| Position |
First Name |
Last Name |
Age |
Linkedin |
| Président |
Nicolas |
LIABEUF |
57 |
|
Nestlé Groupe
DUNS: 542014428
Turnover:
95.5 billion $ (2022)
Description:
Nestlé is a Swiss food and beverage company headquartered in the canton of Vaud, Switzerland. It is the world's largest food company in terms of revenues.
Nestlé products include baby foods, medical foods, bottled water, breakfast cereals, coffee and tea, confectionery, dairy products, ice cream, frozen foods and pet foods
Twenty-nine Nestlé brands have annual sales in excess of one billion Swiss francs, including Nespresso, Nescafé, Kit Kat, Smarties, Nesquik, Stouffer's, Vittel and Maggi.
In 2002, Nestlé acquired Dreyer's Grand Ice Cream Holdings, Inc., an American ice cream company
External Sources and News:

06/02/2024
- .Nestlé est le numéro un mondial de l’alimentation.
- FNB est un fonds d’investissement français spécialisé dans les PME de l’agroalimentaire.
- Nestlé est en négociations exclusives avec FNB pour lui céder ses activités d'aliments pour bébé en France.
- Les produits concernés sont les petits pots NaturNes, les poudres infantiles Babicao et Babivanille, et la gamme de yaourts P’tit.
- Ces produits sont produits par l'usine d'Arches.
- Les ventes mondiales des laits infantiles de Nestlé ont augmenté de plus de 10 %.

02/02/2024
- Nestlé est en négociations exclusives avec le fonds d'investissement français FnB pour la vente de ses activités aliments pour bébé.
- Les gammes concernées sont des potages, purées, desserts et poudres pour le petit-déjeuner sous les marques NaturNes, Babicao, Babivanille et la franchise P'tit.
- Les laits infantiles, le gros du portefeuille - avec Laboratoires Guigoz et Nestlé Nidal -, restent dans le giron de Nestlé France.
- Les produits de nutrition infantile visés par cette vente sont produits dans une usine dans les Vosges qui emploie 230 salariés.
- FnB, le repreneur potentiel, est spécialisé dans l'accompagnement de PME françaises de l'agroalimentaire.
- Le marché de l'alimentation infantile a reculé de 6 % en volume l'an dernier en France en raison de la baisse de la natalité, avec un recul plus fort sur les laits que sur les aliments de diversification.
- Nestlé a 14 usines en France.
- Nestlé has made more than 60 acquisitions since Mark Schneider took the helm in 2017.
- Nestlé Health Science sales have almost tripled in 5 years, from 2.6 billion Swiss francs to 6.6 billion in 2022.
- The global vitamin and mineral market is worth 140 billion Swiss francs (142 billion euros).
- Nestlé has increased its market share in vitamins from 1% to 4% between 2018 and 2021, while it has risen from 18% to 19% over the same period in medical nutrition.
- Nestlé acquired The Bountiful Company in 2021 for 5 billion Swiss francs.
- Nestlé controls 14% of the US vitamin and dietary supplement market.
- The French market for vitamins and dietary supplements reached 2.6 billion euros in 2022, up 3%.
- Nestlé is the leader in clinical nutrition in France, with a market share of 30%.
- 150 employees at the Rosières-en-Santerre plant (Somme).
- FnB is a fund dedicated exclusively to supporting French and European SMEs in the food industry.
- 72% of the dehydrated purée market.
- Nestlé assures us that this sale will have "no impact" on the 150 employees at the site.
- Nestlé targets growth of 7.5% in 2021
- Recurring operating income up 1.4% to CHF 15.1 billion
- Net profit up 38.2% to 16.9 billion Swiss francs
- The leading category is hot and powdered beverages
- The Group pursued its strategy of premiumization and value creation: high-end products account for 35% of Group sales and have grown by 12% in 2021
Data:
DUNS: 542014428
Legal Name: NESTLE FRANCE
Address: 34 RUE GUYNEMER 34-40, 92130 ISSY-LES-MOULINEAUX
Number of employees: Entre 2 000 et 4 999 salariés (2020)
Capital: 130 925 520 EUR
Financial Data:
| Year |
2021 |
2020 |
2019 |
2018 |
2017 |
2016 |
2015 |
| Turnover |
2 154 711 736 |
2 083 346 148 |
2 016 074 659 |
1 940 993 336 |
1 952 058 750 |
1 944 978 698 |
1 977 333 409 |
| Gross margin (€) |
1 269 869 045 |
1 270 946 096 |
1 230 979 062 |
1 145 449 130 |
1 157 419 308 |
1 140 133 163 |
1 145 246 783 |
| EBITDA (€) |
91 583 536 |
103 416 933 |
129 945 891 |
134 925 863 |
130 130 825 |
118 592 111 |
119 138 245 |
| Operating profit (€) |
120 808 151 |
98 746 714 |
88 945 989 |
106 667 765 |
109 686 152 |
70 811 097 |
85 534 573 |
| Net profit (€) |
80 266 664 |
456 827 721 |
58 485 917 |
41 556 816 |
66 445 471 |
90 234 254 |
-50 541 373 |
| Turnover growth rate (%) |
3,4 |
3,3 |
3,9 |
-0,6 |
0,4 |
-1,6 |
- |
| Ebitda margin rate (%) |
4,3 |
5 |
6,4 |
7 |
6,7 |
6,1 |
6 |
| Operating margin rate (%) |
5,6 |
4,7 |
4,4 |
5,5 |
5,6 |
3,6 |
4,3 |
| Working Capital (turnover days) |
21,2 |
94,2 |
26,5 |
30,5 |
21,4 |
14,5 |
11,4 |
| Working Capital requirements (turnover days) |
13,2 |
12,5 |
22,9 |
27,8 |
33,8 |
25,2 |
22,7 |
| Net margin (%) |
3,7 |
21,9 |
2,9 |
2,1 |
3,4 |
4,6 |
-2,6 |
| Added value / Turnover (%) |
20,5 |
21,4 |
22,7 |
24,5 |
24,2 |
24,3 |
24,4 |
| Wages and social charges (€) |
233 304 812 |
226 228 753 |
232 888 598 |
232 099 114 |
236 161 345 |
240 914 940 |
250 872 482 |
| Salaries / Turnover (%) |
10,8 |
10,9 |
11,6 |
12 |
12,1 |
12,4 |
12,7 |
Company Managers:
| Position |
First Name |
Last Name |
Age |
Linkedin |
| Président |
Christophe Olivier |
Cornu |
60 |
|
| Directeur général délégué |
Charlotte Magali Madeleine |
DAVID |
55 |
|
| Directeur général délégué |
Olivier Aime Albert |
Bergere |
60 |
|
| Directeur général délégué |
Pierre-Alexandre |
TEULIE |
54 |
|
| Directeur général délégué |
Marc |
BUTOT |
57 |
|
| Directeur général délégué |
Charles Francois Pierre Napoleon |
Leonardi |
49 |
|
| Directeur général délégué |
Jérôme Pierre |
JATON |
59 |
|
| Directeur général délégué |
Pierre-Claude Ernest Robert |
LAMBERT |
59 |
|
| Directeur général délégué |
Aadil |
Bezza |
45 |
|
| Directeur général délégué |
Thibault Emmanuel Henri |
MOURGUES |
51 |
|
| Directeur général délégué |
Marco |
ZANCHI |
49 |
|
| Directeur général délégué |
Antoine |
DEMAZURE DE PINTEVILLE DE CERNON |
54 |
|

Tesco
DUNS: 03176368
Turnover:
61.5 billion € (2021)
Description:
Tesco plc, trading as Tesco, is a British multinational grocery and general merchandise retailer headquartered in Welwyn Garden City, England. It is the third largest retailer in the world by gross revenues and the ninth largest in the world by revenues
Data:
DUNS: 03176368
Address: TESCO HOUSE SHIRE PARK KESTREL WAY , AL7 1GA , United Kingdom
Number of employees: 440 000 ()
Sainsburys
DUNS: 3261722
Turnover:
28.5 billion € (2018)
Description:
Sainsbury's is the third largest supermarket chain in the UK, with a 16.9% share of the supermarket sector
In 1995, Tesco overtook Sainsbury's to become the market leader, and Asda became second in 2003, demoting Sainsbury's to third place for most of the following period until January 2014, when Sainsbury's regained second place
As of February 2018, the largest global shareholder is Qatar's sovereign wealth fund, the Qatar Investment Authority, which owns 21.99 percent of the company, which is listed on the London Stock Exchange and is part of the FTSE 100 index
On April 25, Sainsburys' merger with Asda was rejected by the U.K. competition authority over concerns about price increases
Data:
DUNS: 3261722
Address: Sainsbury's Supermarkets Ltd, 33 Holborn, London EC1N 2HT
Number of employees: 189 000 ()

Aldi
DUNS: DE 127 135 609 (Aldi Nord) / DE 815643082 (Aldi Süd)
Turnover:
106 billion € (2020)
Description:
Aldi Nord and Aldi Süd Nord are among the leading discounters on the German and international market.
The Aldi Group operates a total of 8,293 stores worldwide, including over 4,200 in Germany.
-
The Aldi Nord Group is represented in nine European countries with over 70 regional, decentralized stores: Belgium, Denmark, France, Germany, Luxembourg, the Netherlands, Poland, Portugal, Spain...
-
The Aldi Süd Group has 31 regional stores.
- The merger of the two companies was completed in 2020
External Sources and News:
- Aldi is becoming one of America's leading food retailers by acquiring the Winn-Dixie and Harveys chains, which have around 400 supermarkets.
- Aldi will have over 2,400 stores by the end of the year.
- Kroger has 3,000 supermarkets and Albertsons 2,300
- Walmart, the largest retailer in the USA, controls almost a quarter of the market.
- After the merger, Kroger and Albertsons should account for 18% of the US food market.
- Aldi's sales in the USA in 2020 amounted to €16.9 billion, compared with €17.2 billion in Germany in 2021
- Aldi has invested $2.5 billion in expansion in the southeastern USA since the 1990s
- Aldi Nord and Aldi Sud have operated jointly in the USA since the Albrecht brothers split up in 1961.
- Lidl invests 4 billion euros to renovate its stores
- Aldi plans to buy Leader Price and invests heavily to double its market share in France
- German hard discounter's market share has doubled in 4 years
- Shelves to resemble those of supermarkets and hypermarkets
In France, the company acquired the 567 Leader Price stores from Casino for 735 million euros.
The new "Aniko" sales concept is intended to renew the portfolio and expand the range of organic and fresh products.
Data:
DUNS: DE 127 135 609 (Aldi Nord) / DE 815643082 (Aldi Süd)
Address: Eckenbergstraße 16 + 16A, 45307 Essen (Aldi Nord) / Burgstraße 37, 45476 Mülheim an der Ruhr (Aldi Süd)
General Mills
DUNS: 319679825
Turnover:
19.17 billion $ (2021)
Description:
General Mills, Inc. is an American multinational manufacturer and marketer of foods sold in retail stores.
The company markets many well-known North American brands, including Gold Medal flour, Annie's Homegrown, Betty Crocker, Yoplait, Colombo, Totino's, Pillsbury, Old El Paso, Häagen-Dazs, Cheerios, Trix, Cocoa Puffs and Lucky Charms.
Some brands are marketed outside the USA and Canada, notably in the UK, through the Cereal Partners joint venture with Nestlé.
Sale of Yoplait to the Sodiaal cooperative in 2021
External Sources and News:
october 17, 2019 - the challenge of a new image for General Mills - source(Les Echos)
- 40,000 employees worldwide
- 51% stake in Yoplait acquired in 2011
- Acquisition of Blue Bufallo for $8 billion (dog food)
Data:
DUNS: 319679825
Legal Name: GENERAL MILLS FRANCE
Address: 30 CRS DE L'ILE SEGUIN , 92100 BOULOGNE-BILLANCOURT
Number of employees: Entre 500 et 999 salariés (2020)
Capital: 31 693 807 EUR
Financial Data:
| Year |
2021 |
2020 |
2019 |
2018 |
2017 |
2016 |
| Turnover |
256 519 114 |
243 018 546 |
222 096 677 |
265 333 062 |
305 300 304 |
310 773 569 |
| Gross margin (€) |
95 625 620 |
103 787 153 |
84 829 743 |
85 480 803 |
101 025 311 |
98 177 054 |
| EBITDA (€) |
12 208 080 |
7 456 488 |
5 812 041 |
6 718 007 |
5 559 020 |
5 436 525 |
| Operating profit (€) |
11 781 608 |
6 858 898 |
4 775 245 |
6 325 906 |
5 006 008 |
4 418 001 |
| Net profit (€) |
1 535 394 |
559 073 |
747 253 |
1 697 276 |
1 624 466 |
-1 880 895 |
| Turnover growth rate (%) |
5,6 |
9,4 |
-16,3 |
-13,1 |
-1,5 |
-1,4 |
| Ebitda margin rate (%) |
4,8 |
3,1 |
2,6 |
2,5 |
1,8 |
1,7 |
| Operating margin rate (%) |
4,6 |
2,8 |
2,2 |
2,4 |
1,6 |
1,4 |
| Working Capital (turnover days) |
65,1 |
62,4 |
50,3 |
73,1 |
54,5 |
91,5 |
| Working Capital requirements (turnover days) |
-15,9 |
9,3 |
-18,1 |
7,4 |
10,9 |
22,6 |
| Net margin (%) |
0,6 |
0,2 |
0,3 |
0,6 |
0,5 |
-0,6 |
| Added value / Turnover (%) |
25,5 |
25,3 |
22,2 |
18,1 |
13,8 |
11,8 |
| Wages and social charges (€) |
51 198 286 |
51 209 611 |
38 028 989 |
36 711 794 |
33 717 203 |
28 947 109 |
| Salaries / Turnover (%) |
20 |
21,1 |
17,1 |
13,8 |
11 |
9,3 |
Company Managers:
| Position |
First Name |
Last Name |
Age |
Linkedin |
| Président |
David, Dominique, Olivier |
BRODOWSKA |
50 |
|

Marks & Spencer
DUNS: 530021799
Turnover:
11.8 billion € (2020)
Description:
Marks and Spencer Group plc is a large British multinational retailer headquartered in London, England, specializing in the sale of clothing, homeware and food products, mainly under its own brand name
The brand announced the closure of 100 stores in May 2018, by 2022.
january 11, 2021 - the impact of Brexit on M&S delivery chains - source(LSA)
- Delivery problems due to Brexit in fresh and prepared products
- Withdrawal from France in 2001, then return in 2011
- 21 franchised stores in France
august 18, 2020 - change of course for M&S - source(Ouest France)
- 7,000 jobs cut due to lower store traffic during the pandemic
- Gradual change of strategy in response to changing consumer habits as they become more digital
- M&S relies on its partnership with online platform Ocado for food distribution
- Decline in clothing sales, but increase in food sales
External Sources and News:

23/02/2022
- Été 2022: Début du partenariat entre Marks & Spencer et Clinique
- 500 références : Nombre de produits Clinique proposés sur le site e-commerce de Marks & Spencer
- 700 magasins Marks & Spencer en Grande Bretagne
- 34 magasins magasins Marks & Spencer avec des corners Clinique et des experts de la marque
- 40 points de vente Marks & Spencer avec des présentoirs proposant des produits Clinique, y compris dans les rayons textiles pour hommes.
- British retail is in crisis.
- Marks & Spencer is closing in France, which will bring a loss of 7,000 jobs, the Brexit is seen as the cause of this closure.
Data:
DUNS: 530021799
Address: 35 North Wharf Road, Londres Angleterre
Number of employees: 80 787 (2018) ()
Company Managers:
| Position |
First Name |
Last Name |
Age |
Linkedin |
| CEO |
Steve |
Rowe |
|
|
| CMO |
Nathan |
Ansell |
|
|